TUFFY’S DUCK ANALYSIS
Because of my personal interests in both waterfowl and computers, I have put together various bits of data on waterfowl harvest and banding recoveries. It exists in spreadsheets, charts, and thematic maps. While I am always thinking of some other angle or perspective that I’d like to explore, the basic layer of it is done and available as a long list of grouped links on my homepage. This is fine but really doesn’t say anything or give the reader much of a way to get into it. I wanted to try to take a look at it and make some effort to summarize it and show the reader at least one structured way of moving through most of it. Where to start and where it will go in terms of analysis seems like an open question, so I expect this to be an ongoing “work-in-progress”. In the meantime, this will have to do as a start. I hope anyone that reads this will keep in mind that it is written by an old turkey hunter in the “off-season” and does not purport to be THE answer in any of its statements. I’ve just tried to note the things that catch my eye and explain why I chose these charts and maps to create and how I would try to take you through them if I had to present them to you personally. Any and all feedback is appreciated, but it’s way too late to make me into either a professional biologist OR writer, so I’m more interested in hearing what you’d like to see and your help in pointing out mistakes that I’m sure I’ll never find on my own. E-mail should be sent to tuffye@ftc-i.net .
I
should start by discussing the type of data being used. Harvest estimates are based on those of the
F&WS and can be expected to be questioned by some. Still, it is the only data known to cover
this area and will serve for our purposes of comparison and I very much appreciate the
effort they make in providing numbers for year-to-year comparisons. The banding data is from a database compiled
by the Bird Banding Lab of USGS and is most subject to my own errors of
analysis and translation into Excel. I’m
certaily hoping not to get any letters from their
legal department on the use of any of this data. I believe it all to be in the public domain
and I’m certainly not trying to do anything but encourage the public to make
use of it and try to understand what some of it is saying.
With
those preliminary comments out of the way, let’s take a look at some of the harvest
data and see what it says to me and what it might say to you. Links are included along the way and you
should be able to return to the narrative by using the “Back” button on your
browser.
The
first thing that seems to help in cutting the subject down to some almost
manageable size is to decide WHICH subset of waterfowl we want to look at. By subset, we are referring to both species
and some identifiable sub-population. To
identify species, we will look at some of the harvest data to try to decide
which are the most “important” in that sense.
Simultaneously, it seems to make sense to identify which locations are
most “important” in harvest terms. If
one believes that last season did not represent any drastic deviation from long-term
harvest norms, we can use it as a baseline for exploring this thought. Looking at the current 2007-2008 harvest
estimates geographically yields this map. The map shows that Louisiana, Arkansas,
Texas, and California clearly lead in total harvest. When we add the species breakdowns by state,
we end up with this chart.
The
states are listed on the bottom axis in something of a geographic pattern with
the Pacific, Central, Mississippi, and Atlantic Flyways listed left to
right. The vertical axis shows the FWS
harvest estimates for the 2005-2006 season.
The legend identifies the various column segment colors used for different
species. Note first the degree to which
California, Texas, Arkansas, and Louisiana stand out in terms of total
harvest. Looking a little closer, we can
identify secondary states in each flyway that are the local leaders. For the Pacific, this would add Washington to
our list. The Central flyway would be
North Dakota. The Mississippi Flyway,
because of it’s greater overall quantity may require the addition of more than one
state. Minnesota, Illinois, and
Mississippi all seem to qualify for inclusion.
Finally, the Atlantic Flyway appears to be lead by North Carolina and
South Carolina, although we can easily justify the addition of New York. Keep in mind that we are, at this point, only
looking at total harvests. Later
analysis of any particular species may change the states that we must
include.
So,
what do we have so far? We have
identified twelve states across the four flyways as being most significant in
terms of total harvest: California,
Washington, Texas, North Dakota, Louisiana, Arkansas, Minnesota, Illinois,
Mississippi, North Carolina, South Carolina, and New York. These should allow us to dig a little deeper
and identify which species we want to take a look at. When we look at these states one at a time,
we can now add the time dimension and take our first look in that way. Keep in mind that we have harvest estimates
for each year since the 1952-53 season. The consistency of these estimates MAY be
open to question as noted above, but it is what we have to work with at this
point. It should be enough to identify
trends in both time and species, though.
Note
that an “Average” line is included in many of the harvest charts. This is based on the Total Harvest divided by
the Number of Hunters estimates. This is
intended to remove the “more-or-less” hunters question from the analysis.
We
will now take a look at overall harvests of ducks in the continental U.S. and
try to identify those areas and species that we may want to look at more
closely. Since there are some states
that I have charted for one reason or another and don’t plan to discuss here,
this might be a good place to just list those for readers that want to see
where their own state fits in. These links will also be included in the
analysis of their flyways but not discussed individually.
Alabama Colorado Delaware Florida Georgia
Idaho Indiana Iowa Kansas Kentucky
Maryland Massachusetts Michigan Missouri Montana
Nebraska New_Jersey Ohio Oklahoma Oregon
Pennsylvania South_Dakota Tennessee Utah Virginia
FOUR
FLYWAYS:
The
continental U.S. has traditionally been divided into four flyways. When we take a look at the breakdown of total
harvest across these flyways, we see the following chart. This clearly shows the overall dominance of
the Mississippi Flyway and seems to exhibit a cyclical appearance that we will
talk more about in terms of specific states below. What this chart does not give us is any sense
of the relative importance of different species in these flyways. For that we must take a closer look at
individual states and come back to that question afterwards since it might be anticipated that species
will have varying importance in different parts of the country. Still, while we are at this level of
analysis, we might want to look at the mix of species in the total harvest across
all four flyways as shown in this chart. We can quickly note here that Mallards are
the dominant species with the BW and GW Teal not far behind when combined. Gadwall and Wood Ducks also show up as
significant segments. We can see some
additional species, but we will wait to find out in which areas they are most
significant.
It
should also be noted that the “Average” lines are on a strong upward trend in
almost every state and the totals as we will see in the charts below. This may very well be a function of the
length of seasons, but I have not performed that analysis. This does bring up an entire area of analysis
that would have to include the number of hunters, which has also been very
cyclical. It’s not what I have been
studying, but certainly deserves a closer look in the context of Harvest.
PACIFIC
FLYWAY:
The
Pacific Flyway
consists of Arizona, California,
Idaho, Nevada, Oregon, Utah, and Washington, and parts
of Montana, Wyoming, Colorado, and New
Mexico. As a group, the harvest in these
states has been primarily composed of Mallards, Pintails, GW Teal, and
Wigeon. This total harvest exhibits a
cyclical pattern over the period of our data.
California: California pretty well dominates the Pacific
Flyway harvest. Still, the charts show
that there have been several significant shifts in harvest from year to year
based on this data. In fact, it is easy
to seem to see a “cyclical” pattern here.
Keep this in mind as it is one that may very well be duplicated in other
states as well. In the case of
California, our data seems to begin during an “up” period. We can see an obvious “low” that seemed to
begin quite suddenly during the 1959-60 season.
Then, we see a period of growth (with the occasional “poor” season mixed
in) that seems to continue through the decade of the 60s and peak in
1970-71. There is a gradual decline
until 1988-89, which seems to be a rather abrupt decline. The early 90s show an upward trend that is
below the levels seen in the previous years.
The 1999-2000 season appears to have been the
beginning of a 4-5 year downturn, but the last two seasons appear to represent
a rebound. Individual species seem to follow this same cycle.
Note
that the “average” line seems to be consistent until we get to the last upward
trend. It appears that the fact that
current levels are lower than previous highs MAY be the result of decreased
numbers of hunters. Averages would seem
to be at their highest levels during this rise.
There is, of course, the matter of season length that I have not
analyzed (Does anyone have the season lengths compiled by states over time?).
When
the species are analyzed, it appears that Mallards, GW Teal, and Pintails are
the most important species in terms of harvest in this state. We might also note here that it may appear
that the main cause of lower total harvest levels in the long-run has been the
decline in Pintail harvest. Mallard and
GW Teal harvests are at or above the levels of the “up” years.
Washington: Washington seems to show a very similar cycle
to that seen in California. However,
there are a couple of differences to be noted here. We can note that Mallards seem to be a much
more significant share of the harvest in Washington, as do Wigeon. The same statement about averages that was
noted for California appear to exist here, too; they are up in recent years and
may represent a decline in hunter numbers and/or longer seasons.
Pacific: Overall the Pacific Flyway looks a lot like
California. Low points were seen around
1960 and 1990. Averages seem to be on
the rise during recent years as hunter numbers have declined. (See Pacific_Hunters.
) What we seem to leave this
flyway with is a recognition of the possible
importance of Mallards, Pintails, GW Teal, and Wigeon.
CENTRAL
FLYWAY:
The
Central Flyway is
currently considered to consist of, Kansas, Nebraska, North Dakota, Oklahoma, South_Dakota,
Texas, and parts of Montana, Wyoming , Colorado, and New
Mexico. As a group, these states display
the same cyclical characteristics as the Pacific, although it may be more
pronounced here. The harvest is quite
diverse with the Mallard clearly dominant, but strong segments of BW Teal, GW
Teal, and, in recent years, Gadwalls.
Texas: Texas appears to be quite dominant in the
Central Flyway. Again, we see the same
appearance of a cycle that we first noted in California. The chart starts in an “up” period with a
drop around 1960, another period of higher harvests, a drop around 1990, and
another rise afterwards. Note there are
some small exceptions here though.
Still, they are very similar and the average appears to be up in recent
years and the fit of the last few seasons into the overall pattern is still
unclear, but appears to be something other than a continued rise. Texas also appears to bring two other species
to our attention: BW Teal and
Gadwall. It should be noted that
Mallards are still very important but there are many species taken in
significant numbers in this state.
North Dakota: North Dakota is the other Central Flyway
state that we examine here and it seems to very much reflect what we had to say
about Washington when talking about the Pacific Flyway. The pattern looks the same but seems to grow
much stronger during the most recent upward trend. Further, again, we see that Mallards are more
important in the more northern state in this flyway, too. Gadwall do show as
an important share of the harvest. If
anything, we may be starting to see a pattern in that the cycles are sharper in
the northern tier of these two flyways and that the relative share of species
harvest is more focused on Mallards in that part of the flyways. The Average line here seems to be more
closely tied to the total harvest and may indicate less of a drop in hunter
numbers than noted in other states.
Central: Overall the Central Flyway doesn’t seem to
differ much from the Pacific in terms of cycles. Low points were seen around 1960 and
1990. Averages seem to be on the rise
during recent years as hunter numbers have declined, perhaps less than in the
Pacific Flyway, though. (See Central Hunters) We still see the importance of Mallards in
the harvest, but now find that we need to consider BW Teal and Gadwall, as
well.
MISSISSIPPI
FLYWAY:
The
Mississippi
Flyway claims the largest harvest of any of the four flyways and has been
cyclical like those we have seen. This
flyway is generally accepted as including Alabama, Arkansas, Illinois, Indiana, Iowa, Kentucky, Louisiana, Michigan, Minnesota, Mississippi, Missouri, Ohio, Tennessee, and Wisconsin. The Mallard is again the dominant species in
the harvest with significant segments of BW Teal, GW Teal, Gadwalls, and Wood
Ducks.
Louisiana: Louisiana has been the leader in total harvest
although Arkansas is very close, if not ahead, in terms of average per hunter,
according to the data that is available.
Louisiana also displays the same apparent cycle that we have been
seeing. The low points around 1960 and
1990 are here as well, as is the recent rise in both total harvest and average
per hunter. Louisiana does show us a
much more mixed harvest than we have seen so far, though. Mallards are important but share that almost
equally with BW Teal, GW Teal, and Gadwall.
Wood Ducks first make a significant appearance, as do Scaup. Because of the overall volume and diversity
of species, we will return to Louisiana in other sections of our analysis.
Arkansas: Arkansas immediately jumps out when we open
this chart after looking at the previous ones.
First, the same cycle is there, but the up years prior to 1960 and those
in the 70s and 80s are much smaller compared to current levels than we have
been seeing. Perhaps even more obvious
is the LACK of harvest diversity here; this is a MALLARD state, it would
seem.
Mississippi: Mississippi looks something like Arkansas
without being able to keep up with that state’s growth in the most recent
years. Mallards are dominant, but there
is a significant segment of Wood Ducks.
The recent importance of Gadwall should be particularly noted as well.
Minnesota: Minnesota is the first northern state we
examine in this flyway. This state does
seem to have the same cycle over time but it is not nearly as clear here due to
the presence of “up” years in the low periods and “down” years in the higher
ones. We may see evidence here of less
southern migration in those down years resulting in “up” harvests in northern
states in those years. Like North
Dakota, hunter numbers would appear to be more consistent as averages seem to track
the total harvest more closely. We also
see that familiar northern importance of the Mallard, but we do see significant
Wood Duck and Gadwall segments here.
Illinois: Illinois looks a lot like Minnesota with,
perhaps, a little clearer cycle.
Mallards are dominant with that significant Wood Duck segment and a
growing harvest of Gadwall.
Mississippi: The Mississippi Flyway harvests a very large
percentage of the continent’s total duck harvest. We do seem to see the same cycle over the
years that we have been noting. We are
seeing something of a trend in maintenance of numbers of hunters here,
though. It seems to be fairly steady in
the northern tier of states here and very much track the harvest in others.
ATLANTIC
FLYWAY:
The
Atlantic Flyway is
also cyclical and consists of those states on the Eastern Seaboard including
Connecticut, Delaware,
District of Columbia, Florida,
Georgia, Maine, Maryland, Massachusetts, New
Hampshire, New_Jersey, New York, North Carolina, Pennsylvania, Rhode
Island, South Carolina,
Vermont, Virginia,
and West Virginia. As a group, the
harvest of this flyway is historically more diverse than most others with large
segments of Black Ducks, BW Teal, Mallards, GW Teal, Ringnecks, and Wood
Ducks. The Mallard is slightly dominant
over the Wood Duck in harvest.
South Carolina: South Carolina does not harvest as many total
ducks as North Carolina in our most recent year of analysis, but we will start
here as it is, technically, the southernmost state we are looking at in this
flyway. (ie. Note that
there is analysis elsewhere that will explain this statement better; NC may BE
the southernmost in this flyway in some sense.
Besides, I live here in SC.)
South Carolina does show us the same cycle we have been seeing in terms
of total harvest but there are significant differences here. The average line seems to show a fairly steady
upward trend over the entire period of our analysis. This state also offers us a good opportunity
to first note some specific species trends, too. The Black Duck decline shows clearly
here. BW Teal, GW Teal, Gadwall, and
Wood Ducks (very much so) seem to be fueling the overall harvest growth here
while Mallards are most indicative of that familiar cycle.
North Carolina: North Carolina, while again showing us the
cycle over the years, exhibits the pattern we had been seeing in northern tier
states in other flyways; averages track total harvest and may indicate less of
a decline in hunter numbers in recent years.
We also seem to see a more diverse harvest here than in the sister state
of South Carolina, although the same species appear to be significant. GW Teal, Wood Ducks, and Ringnecks seem to
fuel the growth and Mallards most closely reflect the cycles.
New York: New York, once again, shows us something of
that familiar cycle, although the recent upward trend is much below that seen
in other states. Mallards are dominant
as in other northern states, but Wood Ducks are strong and we see a very
significant Black Duck segment here. We
may also see evidence of a significant decline in Scaup here.
Atlantic: The Atlantic Flyway does not compare with the
other three in terms of total harvest any longer. It does, however, exhibit very similar cylces and reflect the importance of it’s
own species. Mallards are still dominant
here but we see an increasing share of Wood Ducks and Gadwall. GW Teal, Ringnecks, Scaup, and Black Ducks
come to our attention here, as well.
HARVEST
SUMARY:
Now,
we have taken a closer look at multiple states in each flyway and have
identified a list of species and the states in which they are significant that
we will want to more closely examine. We
could take the step of analyzing each flyway as a whole in terms of species
harvests, but that will be left to the reader with the aid of the following
charts:
Atlantic Mississippi Central Pacific
Similarly,
we could dig yet deeper into the numbers of hunters in different areas, but
that too is not a focus of this analysis and will be left to the reader:
Atlantic Mississippi Central Pacific
Finally, the flyway
breakdowns of different species harvests are available and do give us a point
at which to transition into the banding data below. We will now look at those species that have
been identified above and briefly note their relative importance across
flyways.
Black: Black Ducks appear to be, almost exclusively,
an Atlantic Flyway species. There
appears to be a definite downward trend in this species. They fell short during the upward harvest
trends in the 70s and 80s and have seen nothing of the increases of other
species in the 90s.
BW_Teal: BW Teal are taken across all four flyways,
but, as we have seen may be most significant in the Mississippi and Central
areas. They seem to have been consistent
with overall trends and cycles with a single unusually bad year in 1968-69.
GW_Teal: GW
Teal appear to be a significant segment of the harvest in all four flyways and
to be quite exemplary of the overall trends and cycles that we have seen. They may, in fact, be a growing proportion of
the harvest in many areas.
Gadwall: Gadwall
show indications of the cycle we have noted but show a most definite upward
trend in all flyways with the possible exception of the Pacific, where they are
certainly holding their own.
Mallard: Mallards are, without question, the
indicator species for the overall trends and cycles. They are the dominant species in all four
flyways and will be covered in much detail here as they have been in most
studies.
Pintail: Pintails
appear to be most significant in the Pacific Flyway, although quantities are
taken in the Central and Mississippi.
They appear to be weakening in recent years and, otherwise, consistent
with noted cycles.
Ringneck: Ringnecks are of significance in the
Atlantic and Mississippi flyways and, in the Atlantic, appear to show a slight
upward trend in harvest totals.
Wigeon: Wigeon certainly appear in all four
flyways, but are most significant in volume in the Pacific and, perhaps in
relative significance, in the Atlantic.
Wood Duck: Wood Ducks are mainly a Mississippi and
Atlantic Flyway duck and are very significant as a share of the harvest in the
Atlantic.
Scaup: Scaup seem to display the usual
cycle but appears to be more erratic and possibly has more down years than
other species in recent years. While
taken in all four flyways, they appear to be most significant as a segment in
the Atlantic Flyway with large numbers taken in the Mississippi.
These species can
also be viewed on maps for total harvest by states in my most-recently mapped
2003-2004 season. These may help to
clarify areas and lead to understanding the “sources” that we will discuss in
the banding section below: NOTE that the
legend on each should be consulted for the scale being used in each.
Black BW/Cinn_Teal Gadwall GW_Teal
Mallard Pintail Ringneck
Now that we have
identified major harvest states and species that we wish to examine, we will
turn our attention to the banding data in hopes of understanding something of
the sources and migration routes of these species to and from those areas.
BANDING ANALYSIS
When the subject of
banding data and recoveries comes up, it is easy to start from what might be
the wrong direction. For Example: If one
wants to know something about the migration patterns of ducks in South
Carolina, it just might be that looking at band recoveries here is the wrong
way to go about it. That number is
subject to the relative number of bandings at what one might consider as the
“sources” of those birds, the nesting states and provinces and locations along
the migration routes. A much better
approach might be to work from the other direction and look at where bands put
on in the “nesting areas” have been recovered.
That pattern of distribution seems to provide a much better picture it
seems. Of course, looking at where birds
banded in the “harvest state” are recovered can be similarly helpful but might
be less so because there are usually lower rates of banding in these states
than in the nesting areas and it can be shown that the outflow from the sources
does change from year to year. For
example: Recovering a South Carolina-banded Mallard in Arkansas the following
year certainly doesn’t indicate a direct migration between the two states. It is much more likely that this bird (and,
presumably, others of his group) chose a different path of migration the
following year. Still this is an angle
that, while we will not go into very much, is helpful. Finally, we must remember that we are not
closely examining the time of banding and recovery, either in terms of within
the yearly migration cycle or over the years.
This can make a difference, particularly in the Southern states. If we are looking at birds that were banded
AT their wintering grounds, we are seeing something a little different than if
they were banded enroute. We will be
assuming that most southern banding is done after the peak of migration and,
thus, represents wintering birds and will be looking at their distribution
further north. Note the possible
exceptions to this in North Carolina, South Carolina, and even Louisiana.
NESTING AREA
BANDING:
In order to take
the suggested approach noted above, we must first attempt to identify which
states and provinces we want to consider as the sources. Traditionally, biologists and popular
writings have identified the “prairie” states and provinces as these
areas. If we start with that premise, we
would include North Dakota, Minnesota, Alberta, Saskatchewan, and
Manitoba. Given that basic start and a
handy map, it becomes easy to consider other additions. It is hard not to add Montana and South
Dakota. Looking at Canada and
understanding something of the data, Ontario and Quebec quickly make the
list. For current purposes, that is
where this analysis was intended to end.
However, looking at some species for some parts of the continent forced
the inclusion of additional provinces.
These included British Columbia and the NW Territories to the west as
well as New Brunswick, Nova Scotia, and Newfoundland to the east. (It should be kept in mind that bandings in
these areas are not necessarily of sources in the sense that we intend. Some could be bandings of birds
enroute to Southern points FROM the actual sources. Still, the quantities and this classification
will be helpful.)
This leaves us with
fourteen of what we will consider to be “nesting” states and provinces: NW Territories, British Columbia, Alberta,
Saskatchewan, Manitoba, Ontario, Quebec, Nova Scotia, Newfoundland, New
Brunswick, Montana, North Dakota, South Dakota, and Minnesota. It would not be
hard to argue that significant nesting of some species occurs in other areas
but limiting ourselves to these gives us a slightly more manageable analysis.
An underlying
consideration in which states and provinces to include involves the amount of
data available. The number of birds
banded seems to be irrelevant and it is the number of recoveries that has been
used. Even then, there are typically
large numbers that do not add any particular value as they are recovered IN the
state or province of banding.
The following tables shows the number of band recoveries by species of
those states/provinces and species that we are analyzing. IF these quantities of birds banded (and
subsequent recoveries) were perfect in relative proportion to the number of
birds of these species in these areas, we would have THE definitive starting
point for analysis. Of course this is
not true and the quantities banded and recovered have been the result of
various factors and interests over the years.
Still, it can be accepted that this IS the data we have to work with
and, thus, does define the “sub-populations that we are able to analyze. It should also be noted that this data is
cumulative since the early 1920s and no attempt to show changing trends over
time has been considered at this point.
|
|
Black |
BW Teal |
Gadwall |
GW Teal |
Mallard |
Pintail |
Ringneck |
Scaup |
Wigeon |
Wood Duck |
|
NW
Territories |
2 |
21 |
0 |
477 |
49 |
558 |
128 |
0 |
||
|
British
Columbia |
1 |
109 |
101 |
890 |
27 |
582 |
520 |
292 |
||
|
Alberta |
11 |
61 |
16 |
|||||||
|
Saskatchewan |
126 |
96 |
514 |
29 |
||||||
|
Manitoba |
328 |
708 |
66 |
302 |
374 |
197 |
||||
|
Ontario |
63 |
170 |
226 |
|||||||
|
Quebec |
594 |
69 |
527 |
124 |
9 |
100 |
||||
|
Nova
Scotia |
421 |
22 |
375 |
180 |
396 |
0 |
194 |
395 |
||
|
Newfoundland |
5 |
0 |
12 |
171 |
13 |
2 |
3 |
0 |
||
|
New
Brunswick |
3 |
749 |
922 |
258 |
238 |
1 |
529 |
587 |
||
|
Montana |
7 |
473 |
442 |
273 |
9 |
79 |
381 |
67 |
||
|
North
Dakota |
32 |
299 |
6 |
62 |
482 |
|||||
|
South
Dakota |
24 |
386 |
342 |
3 |
39 |
106 |
225 |
|||
|
Minnesota |
608 |
175 |
334 |
822 |
The links in this
table are active and it does provide a reasonable base for individual
exploration of the data discussed in the sections below.
Now, we must decide
if we will approach these subpopulations from the geographic or species
perspective. Depending on the interests
of the reader, either may be appropriate.
However, for our purposes, we will work with the species and discuss the
state harvests that each of these impact and to what relative degree.
Black Ducks: Black ducks have been primarily an Atlantic
Flyway species as shown in the map of Black Duck Total
Harvest and the chart of the Black Duck Harvest by
Flyway over time. This is reflected in
the areas for which banding data is available.
Of these, the Ontario source has the largest number of recovered bands,
but the coastal provinces provide equal numbers in the cumulative. With that in mind we can begin to look at the
locations in which these bands are recovered.
First, the Ontario
Blacks can be seen to have the widest dispersion, it would seem. This may be misleading due to the physical
size and east-west spread of this province, however. A more detailed study of the bandings in
Ontario would seem to be necessary but it does suffice to note that this
province, along with Michigan
seems to be the primary source for the Black Ducks harvested in the Mississippi
Flyway. Tennessee, in particular seems
to derive most of it’s Blacks from one of these two
sources. It is also important to note
here that both North Carolina and South Carolina receive large numbers from
these two states with South Carolina seeming to benefit significantly more from
the Michigan Blacks than does North Carolina.
As we move to the more eastern provincial sources, we will see that
North Carolina continues to receive significant shares, but that is NOT true of
South Carolina. It may be that we are
starting to see the first evidence of what we may come to see as the southern
END of the Atlantic Flyway for many species as being North Carolina. Quebec and the
Maritime Provinces of New
Brunswick, Newfoundland,
and Nova Scotia
provide the majority of Black Ducks for most of the Eastern Seaboard. These birds seldom seem to venture much below
North Carolina, if that far, however.
So, we seem to see
two populations of Black Ducks emerging from the available data and this level
of analysis. We have a western group
breeding in Ontario and, probably, Michigan that migrates pretty much directly
south with a growing extension to the west into the Mississippi valley. These birds do reach the East Coast, but
primarily in the Carolinas, particularly South Carolina, but no further up or
down the coast. The more eastern
population of the Canadian Maritime Provinces, including Quebec, represent the source of the traditional harvests of Blacks
on the Eastern Seaboard as far south as North Carolina. New York, the leading state for Black Duck
Harvest does seem to take birds from both populations. It might be suspected that this is the result
of the width of the state and represents separate population harvests with
minimal overlap.
BW Teal: BW Teal, while taken in all four flyways, appear to be more focused on the Plains and Prairie states
and provinces as indicated by the areas with available banding data. California does harvest very large numbers,
but the focus of the harvest seems to be the Central and Mississippi flyways as
shown in the map of BW_Teal Total Harvest and the time chart of BW_Teal Harvest by
Flyway over time. It should be noted
that the Cinnamon Teal is included in the harvest numbers and that does
represent a share of the California harvest, in particular. Despite the lower harvest on the East Coast,
we do find significant band recoveries from New Brunswick, which will be
included in our analysis. Thus, we will
be looking at band recoveries from the following states and provinces: Alberta, Saskatchewan, Manitoba, Ontario, New Brunswick, North Dakota, Minnesota, and South_Dakota.
Before we begin to
examine these and try to identify various subpopulations, note that none of
these seem to explain the California harvest.
We will have to accept that the BW and Cinnamon Teal harvested in that
state have not been sufficiently covered by any banding program that we have
identified. The first source on our list, : Alberta, does
provide some quantity of BW Teal to California, but it certainly does not
represent a sufficient share to be that harvest based on the information we
have here. Alberta seems to send most of
its BW Teal down the Central Flyway. As
we will see with several species in the Central and Mississippi flyways, the vast
majority make it to Louisiana with significant numbers recovered in Texas, what
we can see as the wintering grounds.
However, there are two items to note about the recoveries of Alberta BW
Teal. First, they seem to be found more
frequently in Minnesota than traditional views of the migration in the Central
Flyway would have us suspect. It is not
obvious from the data that they fly east to Minnesota and down the Mississippi,
but that recovery quantity does indicate some linkage with more eastern subpopulations. The other item to note with the Alberta BW
Teal is the significant quantity recovered in Florida. The map view might lead us to believe that
these birds regularly overfly Louisiana in that same Southeasterly
direction. Note that the ones taken in
Florida do not appear to have come from a dispersion
across any of the states above Florida.
It would appear straight from Louisiana over water or nonstop along the
coast is their path based on this view.
Looking, in turn,
at the BW Teal sources of Saskatchewan, Manitoba, North Dakota, Minnesota, and South_Dakota, we see
very similar patterns to those from Alberta. We do see increasing numbers of recoveries in
the northern states of the Mississippi Flyway as we move east with our sources,
but, even then, it seems that Kansas continues to receive a very notable share
compared with what is recovered in Missouri and Arkansas to the east. These bandings also indicate the congregating
effect in Louisiana and the overflow into Florida. Is there enough info here to “track” the migration
of the BW Teal of all of these sources and to call it a single subpopulation? That is best left to the reader but it might
be perceived that there is a single subpopulation here that takes a rather
zig-zag route south in migrating. There
may very well be a “staging” that occurs in the lakes of Minnesota and a SW
trek from there towards Kansas. There
seems to be little lingering in Arkansas, but they do end up in Louisiana,
without fail. Far more than we might
have suspected, they even make an apparent overwater or fast coastal trip on to Florida.
Ontario again
appears to present us with an unclear picture.
The dispersion from this state appears to be in TWO parts: an Eastern
and a Western one. We are not doing any
geographic breakdown within states and provinces in this analysis, but this is
certainly a province for which that will be needed at some point to come to
firm conclusions. With the data in front
of us, we will have to conclude that some part of the BW Teal in Ontario are
part of the Western subpopulation we viewed above and others are much more
attuned to the East Coast. This leaves
us with something of a problem on the Southern end of the migration, too. Ontario BW Teal do begin to show quantities
in Alabama and Mississippi that had been missing in earlier sources, but it is
not clear if those are western offshoots of the Eastern Subpopulation or
Eastward movements of the Western Subpopulation that we had not seen in earlier
sources. Since we have NOT seen that, we
will have to conclude that the Eastern birds are extending that far after
coming down the coast. Florida is also
an open question and is probably seeing some of both subgroups from
Ontario. The quantity there seems to large to be overflow from Louisiana as we have seen
before, based on the recoveries in Louisiana.
Still, we might have expected it to be larger for a subpopulation of
coastal migrating birds, based on the North-South focal points we have seen
with this species. It is quite possible
that the Eastern Subpopulation is simply not recovered in Wintering areas as
frequently due to weather and hunting season variances here.
Finally, we look at
our easternmost source, New
Brunswick. The pattern here does
resemble what we saw in the West. There
appears to be “staging” process in the northern tier and very few recoveries
until the Southernmost state that we view, Florida. There are a couple of other things to note
here, though. Louisiana still sees a
relatively significant number of birds from this source, which is rather hard
to explain based on the rest of the map.
It would seem unlikely that they are flying over water from Florida in a
NW direction, but it is possible that they are following the coast and across
upper Florida and on to the West to some degree.
Again, we seem to
see two populations in this species. A
Western one that zig-zags down the Mississippi and Central Flyways to Louisiana
after staging in the Minnesota area and an Eastern population that stages in
New England and, rapidly flies the coast to Florida and perhaps, coastally, on
to Louisiana. We might note that this
species does have this
traditional (ie. Total
East Coast) “Atlantic Flyway” component that we are not going to see in others.
GW Teal: GW Teal are taken in significant numbers in
all four flyways as shown in the map of GW_Teal
Total Harvest and the chart of GW_Teal Harvest by
Flyway over time. As a result, we have a
wide range of banding sources, all of which are Canadian Provinces. These include Alberta and Saskatchewan in the
prairie provinces, Ontario
in the Great Lakes area, and Quebec, Newfoundland, and Nova Scotia in
Eastern Canada. Manitoba is notable by it’s absence, as are the northern tier of states.
When we start with
the Alberta GW
Teal, we see something a little different from what we observed with the BW
Teal. It appears that Alberta IS a clear
source for the GW Teal harvested in California.
While significant quantities do work directly down the Central Flyway to
Texas and Louisiana, we can see the majority recovered in California. Two observations stand out at this
point. First, we do not see many
recoveries of Alberta GW Teal in the coastal states of Washington and Oregon,
but we do see a notable quantity in Utah and Colorado. More study will be required to know, but it
is interesting to contemplate the possible migration paths of these birds. Could it be hopping over the Northern Rockies
to those states? Could it possibly be a
Westward turn out of the Central Flyway in the vicinity of Kansas, which DOES
show a significant quantity of recoveries, particularly for a mid-flyway state? We just do not have enough information here
to say with much certainty.
When we move on to
look at Saskatchewan
GW Teal, we see another source of GW Teal for California, but with a much more
even split with Texas and Louisiana as a Winter
destination. We also see the same
pattern of minimal
Oregon and Washington recovery and bubbles in Utah and Colorado. In fact, if we do not look east of the
Central Flyway, the only difference that we see here is a
somewhat larger share that continue down the central flyway to
Texas. However, we do now start to see a
Mississippi Flyway component to the Saskatchewan GW Teal with notable
recoveries east of the Mississippi River.
We still do not see any sign of a major northern tier “staging area” as
we did with BW Teal. It looks like we
are still looking at the Western subpopulation with only a hint of the
Mississippi one that we will see in Ontario and, perhaps, would in Manitoba if
we had sufficient data there. Labeling
these two provinces as a single population may seem a risk due to the
quantities noted in California, but the en-route focus on the Central Flyway
and the lack of recoveries in the upper Pacific Flyway or states of the
Northern Rockies seems to indicate just that.
Now, Ontario clearly
shows a Mississippi Flyway population with some very interesting East Coast
components that we will look at more closely.
First, much as we saw an Eastern component of the Western population in
the Saskatchewan data, we now see a similar, but much smaller, Western
component in the Ontario GW Teal. A very
few do make it back down the Central Flyway and to California, still apparently
across Utah. Still, the vast majority of
these birds are not looking westward.
Again, we see the effects of the size and spread of Ontario in that we
probably are looking at two subpopulations when we view this data. The westermost of
the two, which will be our second GW Teal subpopulation works down the
Mississippi Flyway to Louisiana. The
Eastern part of the Ontario appears to head Southeastward through New York and
down the coast. There may even be a
sub-sub-population here that heads to the southeastern coast more directly
through Ohio. That is something of a
“reach” from the data available, though, so we will settle for noting a
Mississippi Flyway subpopulation in Ontario and elements of our third, the
Atlantic subpopulation.
It is in Quebec that we start
to see this Atlantic Flyway subpopulation more clearly. Newfoundland and Nova Scotia look very
similar and we will look at them as a group here and try to note any
differences as we go. All three of these
look very similar for GW Teal to what we saw in looking at the BW Teal from
this part of Canada. They seem to move
down the coast and on to Florida, with a surprising number making it on to
Louisiana in some fashion. Differences
here include increased recoveries in the states enroute, including Georgia to a
degree we had not seen before. This may
indicate a tendency to move along only as conditions require rather than the
point-to-point migration of the BW Teal noted above. We also see numbers of recoveries from the
Quebec GW Teal in the upper Midwest, although these could be from the
northwestern part of this large province and more attuned to the Mississippi
subpopulation that we first found in Ontario.
In summary, we seem
to have three subpopulations of GW Teal.
There is a Central Flyway group that is primarily sourced in Alberta and
Saskatchewan, with an odd migration offshoot to California via Utah. Then, we have the Mississippi Flyway group
that is sourced mostly in Ontario with small elements in Saskatchewan and
Quebec. Finally, we have the Atlantic
Flyway group that comes all the way down the East Coast from Eastern Canada and
may even wrap around over to Louisiana at times.
Gadwall: Gadwall, as indicated in the map of Gadwall Total Harvest
and the chart of Gadwall
Harvest by Flyway over time, are present in
significant numbers in the harvests of all four flyways and seem to have a
harvest distribution similar to what we saw in the GW Teal. However, unlike the GW Teal, the Gadwall appear to be experiencing a long-term growth trend in the
three eastern flyways as evidenced by the chart. Still, available data would indicate that
these are birds of the prairie region as indicated by the availability of
banding data. This is supported by the
significantly lower, but growing, harvest in the Atlantic Flyway. As a result, we will be looking at Alberta, Saskatchewan, Manitoba, and North Dakota as the
banding sources for these species.
The data that we
have on this species seems to present a fairly simple picture. The further east we go in looking at sources
the more east we get in one of three “corridors”. The Alberta Gadwalls seem
to hug the western section of the Central Flyway with significant quantities in
the Mountain States of Montana, Wyoming, and Colorado. We also see that same “turn” out across Utah
to California that we noted with the teal and the minimal numbers in Oregon and
Washington from this population. Saskatchewan Gadwalls
seem to travel fairly directly south from North Dakota to Texas with an
increasing “flare” to the East from Kansas into Arkansas, Louisiana, and even
Mississippi. Manitoba Gadwalls would
appear to be less subject
to harvest enroute and seem to move straight on to Louisiana,
although lower quantities from this source may create this illusion. Finally, North Dakota Gadwalls
appear to be something of a mix of the Saskatchewan and Manitoba patterns. They do travel the Central Flyway, but are
mostly bound for Louisiana.
These patterns
appear simple enough that we have to be reluctant to identify separate subpopulations
of this species. There appears to be a
very gradual fade in migration tendencies across the prairie province sources
without the breaks we would have to see to separate them. There are a couple of items to be noted in
this species as in some of the others, though.
We have already pointed out that odd California route of the Alberta
Gadwalls. There also seems to be a
small, but interesting “offshoot” pattern across Tennessee towards South
Carolina by this species. This seems
consistent with what we first noted in the Black Ducks and may represent a
Tennessee/South Carolina aspect of the Mississippi Flyway for puddle
ducks. This is not a particularly new
idea and has been noted by researchers such as Frederick and Peterson in the
past. It is a fact that is often
overlooked in general conversation, though, and a noteworthy item when
indicated. A Southern “end” to the
Atlantic Flyway above South Carolina has not been a part of popular writing on
the subject.
Mallard: The Mallard has been studied more extensively
than perhaps any other species and there is little that this analysis could add
to the work of numerous professionals.
Still, we will present the same types of charts and maps as we have for
other species and leave it to the reader to analyze. We will, however, note those items of
interest that may show up in the data and be easily overlooked.
The Mallard is the
dominant species in the U.S. Duck Harvest as noted early on in this
analysis. The map of MallardTotal Harvest and the chart of Mallard Harvest by
Flyway over time support this and show that this species is harvested in large
numbers in all four flyways. One thing
that might be noted at this point is the added importance of the Mallard in the
harvests of the Northern states. It is
with this species that Washington, Minnesota, and similar states match up with
the Southern ones in harvest.
Large numbers of
bands have been recovered from all of the sources that we have been viewing
except for the Canadian Maritime Provinces.
This leaves us with views from Northwest Territories,
British Columbia,
Alberta, Saskatchewan, Manitoba, Ontario, Quebec, Montana, North Dakota, Minnesota, and South_Dakota for a
total of eleven sources.
Amidst this mass of
data, that Tennessee-South Carolina offshoot from the West does show up
significantly for the sources of Alberta, Saskatchewan, Manitoba, and Minnesota. Quebec exhibits
that East Coast migration down TO North Carolina. It is also interesting here Aside from that, we will leave it to the
reader to review the massive information available on this species.
Pintail: The Pintail, as indicated by the Pintail Total
Harvest Map and the Pintail
Harvest by Flyway over time chart, seems to be predominantly a Pacific Flyway
species. Still significant quantities
are harvested in the states of the Central Flyway and the western half of the
Mississippi Flyway. As with many species,
Texas and Louisiana see the largest numbers within their respective flyways. There does appear to be evidence of the
now-familiar harvest cycle over the period of our data, but there seems to be a
definite weakening trend for this species in the Pacific Flyway, which is the
bulk of the harvest. We have banding
data to examine from the western provinces and the states that we have
designated as sources. This will give us
nine banding sources: Northwest Territories,
British Columbia,
Alberta, Saskatchewan, Manitoba, Montana, North Dakota, Minnesota, and South_Dakota.
The Pintail and
Mallard are the only species for which we have sufficient banding data from the
Northwest Territories and British Columbia for analysis and we will start with
them. The Northwest Territories
Pintails data seems to pretty much reflect the overall harvest distribution
that we saw above. The east-west spread
of this province probably does not allow us much help in identifying
subpopulations or migration from this province.
If we were to look at it in segments, it might be expected that we would
see groups that would correspond with those we will see in the southern tier of
provinces.
The first of these
southern provinces, British
Columbia, seems to be primarily a source for Pacific Flyway birds, as we
might have suspected. There may be
something to be noted in the relatively low proportion of California recoveries
from this source and the number that are recovered further north in Alaska,
though. This may indicate that this
source is representative of a quite northern subpopulation that does not
venture as far south as others.
When we get to Alberta, we do not
seem to have that same significant pattern.
We now see the weight of California in our data and note that, even from
this far west in our sources, there is a clear trend growing in the Central
Flyway and towards Louisiana. We also
can note the Utah quantity here as being very significant. As we saw with the teal species earlier, Utah
does seem to have some unclear “link” to the more eastern sections of the
Central Flyway.
Saskatchewan and Manitoba continue
that trend as we move to the East and, with Saskatchewan,
we now see Texas and Louisiana together matching the California share. By Manitoba, both exceed California on their own. We can
also see a few things starting to show in terms of more eastern recoveries from
these two sources. We again see that
Tennessee-South Carolina offshoot, but North Carolina now seems to hold its own
with its more southern sister state for this species. We can also see some degree of the Florida
overflow from, apparently, the Mississippi flyway, again. Even this far East, we have to note that California is still drawing
notable quantities, apparently from the Utah exit of the Central Flyway,
although there is not enough here to say that with certainty.
As we look at the
northern tier of states that we have included in our sources, we see pretty
much replications of the provinces above them. Montana seems to
harbor the California bound subpopulation with the Utah contingent, while , North Dakota and South_Dakota are
primarily Central Flyway and western Mississippi Flyway birds. Minnesota, the most eastern of all of our studied sources of Pintails, show
a decidedly Mississippi Flyway flavor.
Another small oddity that we note with the state sources here is that
the Tennessee-South Carolina offshoot starts to look much more like a
Tennessee-NORTH Carolina offshoot, even, to a small degree, as far west as
Montana.
We might be better
off to look at Pintail sources and see only a “fade” in migration as we did
with the Gadwalls. However, the lines do
seem a little sharper here and I suspect that further breakdowns in the
provinces would reveal four subpopulations for Pintails. We saw hints of a “Northen
Pacific” population in data from British Columbia and we saw a “Southern
Pacific” population in Alberta and Montana.
Saskatchewan and the Dakotas seem dominated by a Central Flyway group
with some ties to Utah and California.
Finally, Manitoba and Minnesota, and perhaps other sources not
available, indicate a Mississippi Flyway population with links to the East
Coast through the Tennessee-Carolina offshoot.
Ringneck: The Ringneck
Total Harvest Map and the chart of Ringneck Harvest by
Flyway over time indicate that this species is most important in the
Mississippi and Atlantic Flyways with the usual cycle and what appears to be an
upward trend. Certainly, this data
indicates that the earliest “up” period in our study time frame did not have
the numbers recorded that we have seen since. There also seems to be a lot of variability
in the harvest here, though, in that there are many years that seem to rise or
fall significantly away from the trend of the time. The map does perhaps show a more direct
migration than for some species; if they are not harvested in Minnesota or
Wisconsin, they tend to make it all the way to Texas, Louisiana, or
Florida. Still, the harvest seems to be
spread fairly evenly in between and this may be misleading and not the best possible
interpretation.
Banding data is pretty
sparse for the sources we are examining but we do have a great deal of data
from Minnesota
and have included the small number from Ontario.
Minnesota does
offer by far the most data and, as might be expected, it matches the harvest
distribution in many respects with a few highly notable exceptions. One is, of course, in the area of North
Carolina and South Carolina. Minnesota
band recoveries of Ringnecks do not seem to indicate that state as being the
source of the Ringneck harvest in North Carolina, as they do for South
Carolina. We also see major recoveries
in the Deep South states of Mississippi, Alabama, and even Georgia, indicating
that the eastward shift for this species is more broad
and not aimed at the Carolina coast as with other species.
Ontario does seem
to show a source of North Carolina Ringnecks, along with South Carolina, but we
do not see the Tennessee route in that data.
Further, we can not be sure that we are not again looking at more than
one population when we view Ontario.
Only the lack of Tennessee recoveries makes me inclined to see an
Atlantic Flyway population that extends down to South Carolina and beyond for
this species (note Florida). However, there does not appear to be significant
recoveries of Ringnecks in the states above the Carolinas in either direction
until you get all the way up to Michigan and Wisconsin.
There do appear to
be two subpopulations of this species, but I suspect that we are missing a
major source in the East for which data is not available. As it is, we can see a Mississippi Flyway
population with the Tennessee-South Carolina offshoot and we can see hints of a
traditional full-coast Atlantic Flyway population.
Wigeon: The Wigeon
Total Harvest Map and the chart of Wigeon
Harvest by Flyway over time indicate that the Wigeon is significant in the
harvest of all four flyways with the Pacific slightly leading in total harvest.
The harvest over time appears to be familiar in terms of harvest with a couple
of low years in the mid-70s in the middle of that overall upward trend.
Banding data is
hard to come by for Wigeon in our source areas, but we do have almost identical
quantities of recoveries from the duck factories of Alberta and Saskatchewan. The similar sizes should help us in looking
at their distribution but it is unlikely that just these two will allow us much
of a breakdown into subpopulations.
When we look at Alberta, we do seem
to see a clear Pacific Flyway source, though.
We even see that this one starts up in Washington and extends down the
coast. Idaho and Utah are well
represented, which may give us second thoughts about the path to Utah that we
considered with other species. The
Colorado and Texas recoveries, in the absence of numbers from the upper plains
states, may even give us the impression of a Western Central Flyway population
here as well. It is clearly not
comparable with the first one, though.
As we move on to Saskatchewan, we
still can see a very significant representation of the Pacific Flyway
population, but we can now see a clear Central Flyway population up and down
the plains states. This province would
seem to have elements of at least two subpopulations as we also have to note
the hints of a Mississippi Flyway component with, perhaps, a NEW eastern offshoots. Instead of the obvious now-familiar
Tennessee-South Carolina offshoot, it looks like we might see a more northerly
one towards the Chesapeake Bay and down the coast from there. This is more of the traditional path that I
have heard discussed in linking the Southeastern states and the Chesapeake;
that there was a SE migration to the Bay and a turn South from that point. Although we are not including it here, this
may be the traditional Canvasback migration of an earlier time.
So, we seem to have
hints of at multiple subpopulations in just these two sources. There is a
decidedly Pacific Coast group, strong indications of both a mountain and plains
component of the Central Flyway, a standard Mississippi Flyway group, and an
Atlantic Flyway one that begins with a movement from the NW to the Chesapeake
Bay area.
Wood Duck: The Wood_Duck
Total Harvest Map and the chart of Wood_Duck
Harvest by Flyway over time show that the Wood Duck is a Mississippi and
Atlantic Flyway species and very important to the overall harvest in the
Atlantic, in particular.
Available banding
data for the Wood Duck reflects the eastward emphasis on this species and we
have significant data available only from the Eastern Provinces of Ontario and Quebec, along with the
state of Minnesota. Before we even look, it is not hard to guess
what we will see. Minnesota can be
expected to provide the Mississippi Flyway birds, it will probably seem. Quebec will be focused on the Atlantic. Ontario will seem to send birds in both
directions, again due to its size and geographic width, I’d suspect. Due to the breeding habits of the Wood Duck,
it is more than likely that our concept of sources leaves a lot to be
overlooked with this species. Breeding
across much wider latitudes in significant quantities, it will be necessary for
the reader to look much more closely at the bandings and subsequent recoveries
in many other states. Even then, I would
guess that we would always see shorter migrations south from those sources IF
we could separate the sources from the destinations in those states. Could we?
Yes, I think that looking at the bands put on during the breeding season
only would allow for that to some degree.
With this knowledge, the information below should certainly be taken
lightly with many questions in the mind of the reader.
Minnesota, as we
noted above, appears to be the source of Wood Ducks for the Mississippi and
Central Flyways. There is a
Tennessee-South Carolina offshoot and Florida does seem to have significant
numbers from this source. Despite the
considerations above, the data does seem to indicate a species with a major
North-to-South migration, certainly in the Mississippi Flyway.
Quebec does show that
Atlantic Flyway population that we expected and, again, we see a more
significant reach for it than we might have guessed. This species from this source is, along with
the GW Teal, one of the few that seems to utilize the Atlantic Flyway from top
to bottom.
Finally, we turn to
Ontario and I am a
little surprised NOT to see that “split” that I have come to expect from this
province. We seem to see a fairly strong
focus towards the Atlantic Flyway, although it joins that Flyway only in New
York and below. It MAY be that, like the
GW Teal we looked at earlier, we can even see a “wrap-around” effect into the
Gulf Coast states of the Mississippi Flyway with this species. If I had to guess why the picture looks
different for this species in Ontario, I would think about the lesser emphasis
on banding Wood Ducks in those parts of this province that might be expected to
feed the Mississippi Flyway more directly (ie. The western part).
So, we do manage to
see two subpopulations of Wood Ducks with more extensive migration than I would
have guessed. There is a Mississippi
Flyway group with Central Flyway representation in Minnesota and, probably,
other provinces and states for which we do not have data. There is also a fairly traditional Atlantic
Flyway subpopulation that also moves more than just a couple of states.
HARVEST AREA
BANDING:
As mentioned above,
we could look at bandings in harvest states and use that data to map the
“sources” of those birds. It could be
argued that ALL states should be included in this approach, but it seems that
looking at the other end of the migration might be sufficient and will also
encompass many of the major harvest states that were not included in sources. With this in mind, I’ve narrowed my list down
to a “Southern Tier” of states that includes the following: Alabama, Arkansas, California, Florida, Louisiana, Mississippi, North Carolina, South Carolina, Tennessee, Texas, and Utah. These links show Total Recovery distributions
for all species (being studied here) banded in those states. As with the nesting sources, we can look at
individual species and come up with the following table:
|
SOURCE |
BLACK |
BW TEAL |
GADWALL |
GW TEAL |
MALLARD |
PINTAIL |
RINGNECK |
SCAUP (L.) |
WIGEON |
WOOD |
|
FLORIDA |
17 |
137 |
6 |
73 |
116 |
27 |
||||
|
NORTH CAROLINA |
27 |
56 |
116 |
|||||||
|
SOUTH CAROLINA |
482 |
8 |
192 |
|||||||
|
ALABAMA |
40 |
26 |
10 |
187 |
569 |
65 |
583 |
|||
|
ARKANSAS |
228 |
28 |
8 |
26 |
77 |
233 |
49 |
227 |
||
|
LOUISIANA |
32 |
74 |
346 |
|||||||
|
MISSISSIPPI |
118 |
29 |
62 |
38 |
36 |
24 |
144 |
|||
|
TENNESSEE |
94 |
6 |
83 |
99 |
208 |
15 |
233 |
|||
|
TEXAS |
1 |
222 |
52 |
25 |
182 |
408 |
56 |
|||
|
CALIFORNIA |
24 |
5 |
76 |
582 |
||||||
|
UTAH |
1 |
24 |
254 |
0 |
22 |
216 |
0 |
As harvest states,
we may be more interested in looking at these from the geographic, rather than
the species, perspective. Of course, the
chart above would allow either view, but our analysis will move from state to
state. Note that the table above is
arranged by FLYWAYS, with the states alphabetically within each. That is the way we will move through them
here.
Pacific
Flyway: When we look at the Pacific Flyway, we have
two states for which we will examine band returns: California and Utah.
California, we remind
ourselves, dominates the harvest of this flyway. We also noted earlier that the harvest is
quite diverse and we see that indicated in the table of recoveries from species
banded in this state. The species we
will look at here include Gadwall, GW_Teal, Mallard, Pintail, Wigeon, and Wood Duck. As we look through these recovery maps, we
can note the unusually large percentage that are recovered within the state of
banding, California. We can also see
that very few are recovered in the Canadian provinces. Only the Pintail, Wigeon, and Mallard seem to
show significant quantities outside of California. The Gadwall, GW Teal, and
Wood Duck would make one wonder if these birds STAY within (or very near) the
state or if it is just that they are not harvested and/or studied in other
states and provinces. Gadwall seem to venture to Oregon and Nevada.
The GW_Teal seem to go no place except Utah, which is
very interesting as it appears here. The
Wood Duck may have sufficient room IN California for their limited
migrations. The Mallard seems to show a very straightforward North-South migration as we noted
from Alberta earlier. This is the “pure”
Pacific Flyway that we might expect. The
Pintail appears fairly similar with an extension on each end
of the migration. We see significant
recoveries north into Alaska and we also seem to see enough in Arizona, Texas
and Louisiana to make us think that California is not the Southern end of the
migration for this species. Also, there seems to be a
path directly north of Texas to Saskatchewan in Canada that seems to give us
the picture of a complete “loop” in this species. Utah seems to be the bull’s-eye in that
loop. The possibilities here are very
interesting and could show either a real loop in a given year or a variation in
year-to-year migration between the Pacific and Central Flyways for this
species. Finally, the Wigeon looks a
little similar to the GW Teal with those quantities in Utah, but with, perhaps, even less of a venture
north of California.
Utah offers us
sufficient band recovery quantities to look at the GW_Teal,
Mallard, and Pintail . We appear to be looking at the same
populations of GW Teal and Pintails here that we did in California. The GW Teal seem to be trading only between
the two states and we see Utah as the bull’s-eye in our Pintail “loop”,
again. The Mallard, however, appears to
be separate from the population of that species we saw in California. We may even be looking at a self-contained
Rocky Mountain population here as we see low quantities in the Canadian
provinces with significant numbers in Idaho and other mountain states.
Central
Flyway: In the Central Flyway, we look only as Texas
as our Southern tier harvest state.
Texas offers us views
of the same three species that we examined in Utah: GW_Teal, Mallard, and the Pintail. The GW Teal shows something here that we
might not have expected. We see a link
to California that was not as obvious in the California numbers. We also do not see this population as being
linked to Utah. It is not at all clear
how we missed this component in California numbers, but it seems clear
here. The Texas Pintails seem to be a
consistent part of the loop and bull’s-eye we have already noted and the
Mallard seems to be a pure Central Flyway pattern.
Mississippi Flyway: As we arrive at the Mississippi Flyway, we
now have a number of states and species to examine. We will examine bandings from Alabama,
Arkansas, Louisiana, Mississippi, and Tennessee. These states will offer us various views of
Black Ducks, BW Teal, GW Teal, Mallards, Pintails, Ringnecks, Lesser Scaup, and
Wood Ducks.
Alabama offers us
bandings of Blacks, Mallards, and Wood Ducks. There are not many surprises here. The Black Ducks appear to come straight south
to Alabama, though, and do not appear to be part of any coastal flyway from the
traditional New England areas. The
Mallards seem to be very straightforward “down-the river” birds, too. As we move more to the West, we will see more
Central Flyway intermingling, but not here.
Finally, the Wood Ducks show the local migration of this species with
just enough in the Upper Midwest to make us wonder if there are some changes in
some years.
Arkansas lets us look
at significant numbers of bandings for Mallards and Wood Ducks. We come to the Land of the Mallard and we see
a much wider funnel opened to the prairie provinces of Canada. Ontario is not nearly as important here as in
Alabama and points to the East, but there are indications (in Misc. section)
that this is growing. The Wood Duck
pattern looks very similar to Alabama with a little shift to the West. There is still that apparent local migration
and the numbers in the Upper Midwest that make us wonder.
Louisiana has the widest
variety in this flyway with useable numbers of BW_Teal, GW_Teal, Mallards, Pintails, Ringnecks, Lesser_Scaup, and Wood Ducks. Here, there is a lot to look at. This is obviously the spout of the main North
American funnel for most species and it shows.
For some, it even seems to have feeder channels from East and West as
well as the North. BW Teal are from the
Central and Mississippi Flyways, in fairly equal proportions, it seems. We should note the quantity in Minnesota (and
the lack of numbers above there) as possibly indicative of the nesting area
being within that state. Finally, a
number of BW Teal appear to move ON to Florida via Louisiana as noted in the
Nesting Area discussion. The GW Teal
looks very similar, even in terms of Minnesota, but we now see our first feeder
stream. California, as noted in the
discussion of that state, does seem to send this species on to Louisiana, but
we do not see much of an extension on into Florida for the GW Teal. The Mallard seems to show a wider version of
the funnel we saw in Arkansas with a stronger Central Flyway input and a little
eastern feeder stream from New York and the Ontario area. With the Pintail, we see the Central and
Mississippi funnel, but the West Coast feeder is more pronounced and less
direct from California with a clear trans-mountain route via Utah and
Colorado. There may also be evidence here
of the Tennessee-North Carolina outflow noted in Nesting Area analysis, but it
is not clear how it ties to Louisiana; perhaps as a “some years” route for the
Mississippi. The Ringneck and Lesser
Scaup both look pretty much North-South from Minnesota with a possible
extension on to Florida more inland than that of the BW Teal. Finally, the Wood Duck may show a narrower
local dispersion and more of a true migration from the Upper Midwest, although
that may be a stretch of what we can see here.
Mississippi offers us Mallards,
Ringnecks, and
Wood Ducks. The Mallard shows no surprises in Mississippi
with a pure Mississippi Flyway pattern, including the Tennessee-South Carolina
offshoot of this group. The Ringneck
looks a lot like Louisiana with that Minnesota-Gulf Coast-Florida pattern. We may see more importance in Ontario here
though. The Wood Duck looks similarly
familiar, too, with a slightly more pronounced feeder from New York.
Tennessee shows us the
largest quantities in this flyway for Black Ducks, Mallards, and Wood Ducks. Tennessee brings us to one of the most
unclear areas on the continent. I think
that this is a critical state in understanding the migrations of ducks in the
Easter United States, as is the Canadian Province of Ontario. Both seem to represent important links
between the Atlantic and Mississippi Flyways.
Like Ontario, this state has a wide East-to-West spread that may serve to
confuse the data at this level, though. When we look at the Black Ducks here, we several facets of the
pivotal role that this state plays in the East. Here it appears to be the pathway to Alabama
and Mississippi for Ontario Black Ducks.
We also see a clear link to the East Coast Blacks of New York,
Pennsylvania, Virginia, and the Carolinas.
It is quite possible that we are seeing two separate populations
here. One down the
Tenn. River valley to the Gulf States and another feed INTO Tennessee from the
East Coast. Turning to the
Mallards, the picture, is, if anything, even more
complex. We may see those same two
patterns, but there are some additional ones now. First, we can note a significant funneling
from the Prairie Provinces of Saskatchewan and Manitoba, probably a part of the
flow to Louisiana via Eastern Arkansas and Western Tennessee. We also see a marked indication of an
offshoot INTO South Carolina from the Mississippi Flyway. Unlike the Black, the numbers do not indicate
as much a down-to-Carolina-over-to-Tennessee look as we do not see the numbers
above South Carolina now. This is a
pattern we have noted and will get back to when we reach South Carolina. Finally, the Wood Duck seems to show both a dispersion below Tennessee and stronger links to the
northern states than we have noticed in other Southern states. Tennessee appears to be more of a bridge
between the two types of Wood Duck populations than others have been.
Atlantic
Flyway: In the Atlantic Flyway, we will look at
Florida, North Carolina, and South Carolina and be able to examine returns of
Black Ducks, GW Teal, Mallards, Pintails, Ringnecks, Lesser Scaup, and Wood
Ducks.
Florida allows us to
look at some quantities of Ringnecks, Lesser_Scaup, and Wood Ducks, with a
very small quantity of Mallards. The divers here, Ringnecks and Scaup, appear
to originate in the Upper Midwest states of Minnesota, Wisconsin, and Michigan
and the Canadian Provinces of Ontario and Manitoba. The Scaup seems to tend a little more towards
a “western” migration down through Louisiana and originates a little more
frequently in Manitoba. The Ringneck has
more of a focus on Ontario in the north and displays more of a spread across
the Gulf Coast states into Florida. The
Wood Duck appears to be more of a north-south migrant in this view, but the
large quantity recovered within the state may be indicate
otherwise. Still, there is an element of
Ontario sourcing to the species here.
Finally, the low numbers of Mallards still clearly shows Florida as
being in the Mississippi Flyway for this species in what migration to this
state does occur.
North Carolina has
diversity of species in significant numbers that even exceeds that we saw
earlier in California. Here we have Black
Ducks, GW_Teal,
Mallards, Pintails, Ringnecks, Lesser_Scaup, and Wood Ducks. This state is, I believe, the lower end of
the East Coast aspect of the Atlantic Flyway and will demonstrate that for many
of these species. The Black Duck we can
see as a coastal migrant from Ontario and, more notably, Quebec on down through
New York, New Jersey, and Virginia. It
is important to note here that Black Ducks banded in North Carolina are seldom
recovered further south. The GW Teal
looks very similar with an even greater emphasis on the more eastern province
of Quebec. Again, we see smaller
quantities below this state, but, perhaps, enough in South Carolina to indicate
that this species does proceed further.
For the Mallard, we do not see a clear pattern here. While we do see an eastern migration down
from Ontario through New York, Pennsylvania, and Virgina,
we also see significant quantities from the Upper Midwest states of Minnesota,
Wisconsin, and Michigan. We also see
something of a spread below North Carolina across the Gulf Coast States. It is only when we get to South Carolina and compare the two states that we can more clearly see a
difference in the dispersion pattern.
Pintails look like another down-the-coast species similar to the Black
Ducks and GW Teal, but we now see a clearer extension on into Florida. The Ringneck looks very much the same until
we remember that this area did not appear to represent a significant share of
the Florida pattern for this species.
The Scaup is, again, very similar, but now gives us a clear look at a
traditionally accepted migration pattern southeastward from the Great Lakes to
the Chesapeake Bay area and down the coast from there. Looking back over the other species with this
now noted, we can see that type of pattern in at least the Ringnecks, Pintails,
and Mallards, if not others. Finally,
the Wood Duck looks like very much a migratory species in this view. Again, the number of in-state recoveries may
be an indication otherwise, though.
South Carolina does not
offer us the variety or the quantities that we have in North Carolina, but,
since we don want to make some close comparisons between the two states, we
will look at many of the same species.
These will include GW_Teal, Mallards, Ringnecks, Lesser_Scaup, and Wood Ducks. As we get to this final state in our
analysis, my home state, it may be easy for me to be influenced by what we have
already seen. Looking merely at the GW
Teal dispersion, this looks like a simple East-Coast migrant, but we remember
the lower numbers moving on below North Carolina and realize that we are
probably looking only at that small subset here. It is with the Mallard in South Carolina that
we get to one of the most notable maps of all.
Again, we have to go back and compare it to that of North Carolina for
the difference to stand out. South
Carolina clearly disperses Mallards in a much more westerly direction than does
North Carolina. For this indicator
species, the most important of all in the harvest, these two states do appear
to be in different flyways. Note the
much greater importance of Tennessee, Illinois, Wisconsin, Minnesota, and
Manitoba here. We even see a notable
quantity in Saskatchewan. Although South
Carolina does interact with northeastern states, it would appear to be more
clearly a part of the Mississippi Flyway for this species. Yet again, we have to point out that this has
been noted before, but deserves repeating with the
implication that South Carolina, Georgia, and Florida may need to be more aware
of the importance of species migration in that flyway rather than the
traditional Atlantic. We see this same
relationship repeated for Ringnecks and, to a lesser extent, the Scaup. The Scaup seems to have that more western
source even for North Carolina and be, perhaps, indicative of that Great
Lakes-Chesapeake-Carolinas route.
Finally, the Wood Duck patterns look very similar for both states.
SUMMARY
TBD…..
AUTHOR’S COMMENTS
We have looked at a
lot of charts and maps here and I have made many comments that, admittedly,
often stretch interpretation of the data.
We have also seen several areas and items that require closer
examination and/or additional data. I
would hope that the reader would utilize my comments only as cues to their own
ideas and interpretations. If they have
made the reader think about other possible explanations for what the data shows
or raised questions in new directions, they have more than served their
intended purpose. I would hope to
receive some of those views and questions and would be interested in exploring
some of them, I’m sure. I would expect
to add to this and make modifications as time and thought dictate.
Please remember
that I am in no way an expert on either Waterfowl Biology or computer graphics
and do not hold me to those standards in your comments. Please do feel free to send me your comments,
however. I think that many groups and
individuals have made remarkable contributions to knowledge in this area and I
hope to stimulate some degree of interest in their work and its
possibilities. I would especially thank
the folks at the Bird Banding Lab, Woody Martin and B.H. Powell in particular,
for their assistance in providing enough to keep an old Southern Gobbler Chaser
busy throughout a poor duck season.
While many of us do have other interests that consume much of our work
and recreational time, a love of waterfowl is also something that many of us share and love from someplace deep in our hearts. It is a part of our national and sporting
heritage. Many of us approach it in
different ways and with different methods as we do life in general. May we always have this respect for the birds
and one another.
Thank you if you’ve managed to make it to this point; you have
demonstrated your love of waterfowl.
Isaac G. “Tuffy”
Edwards
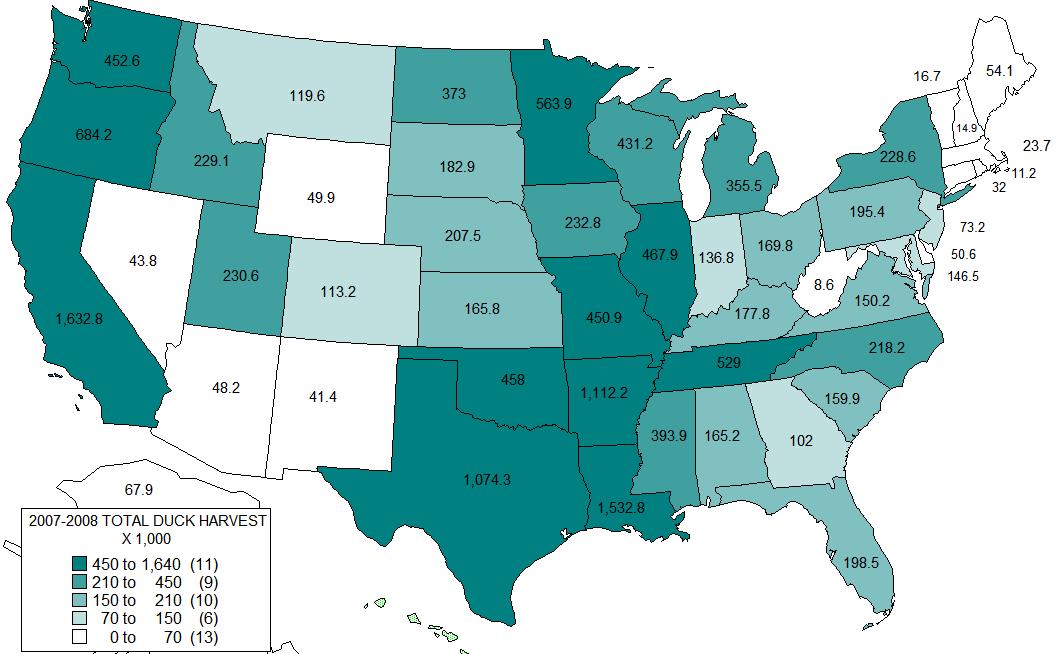
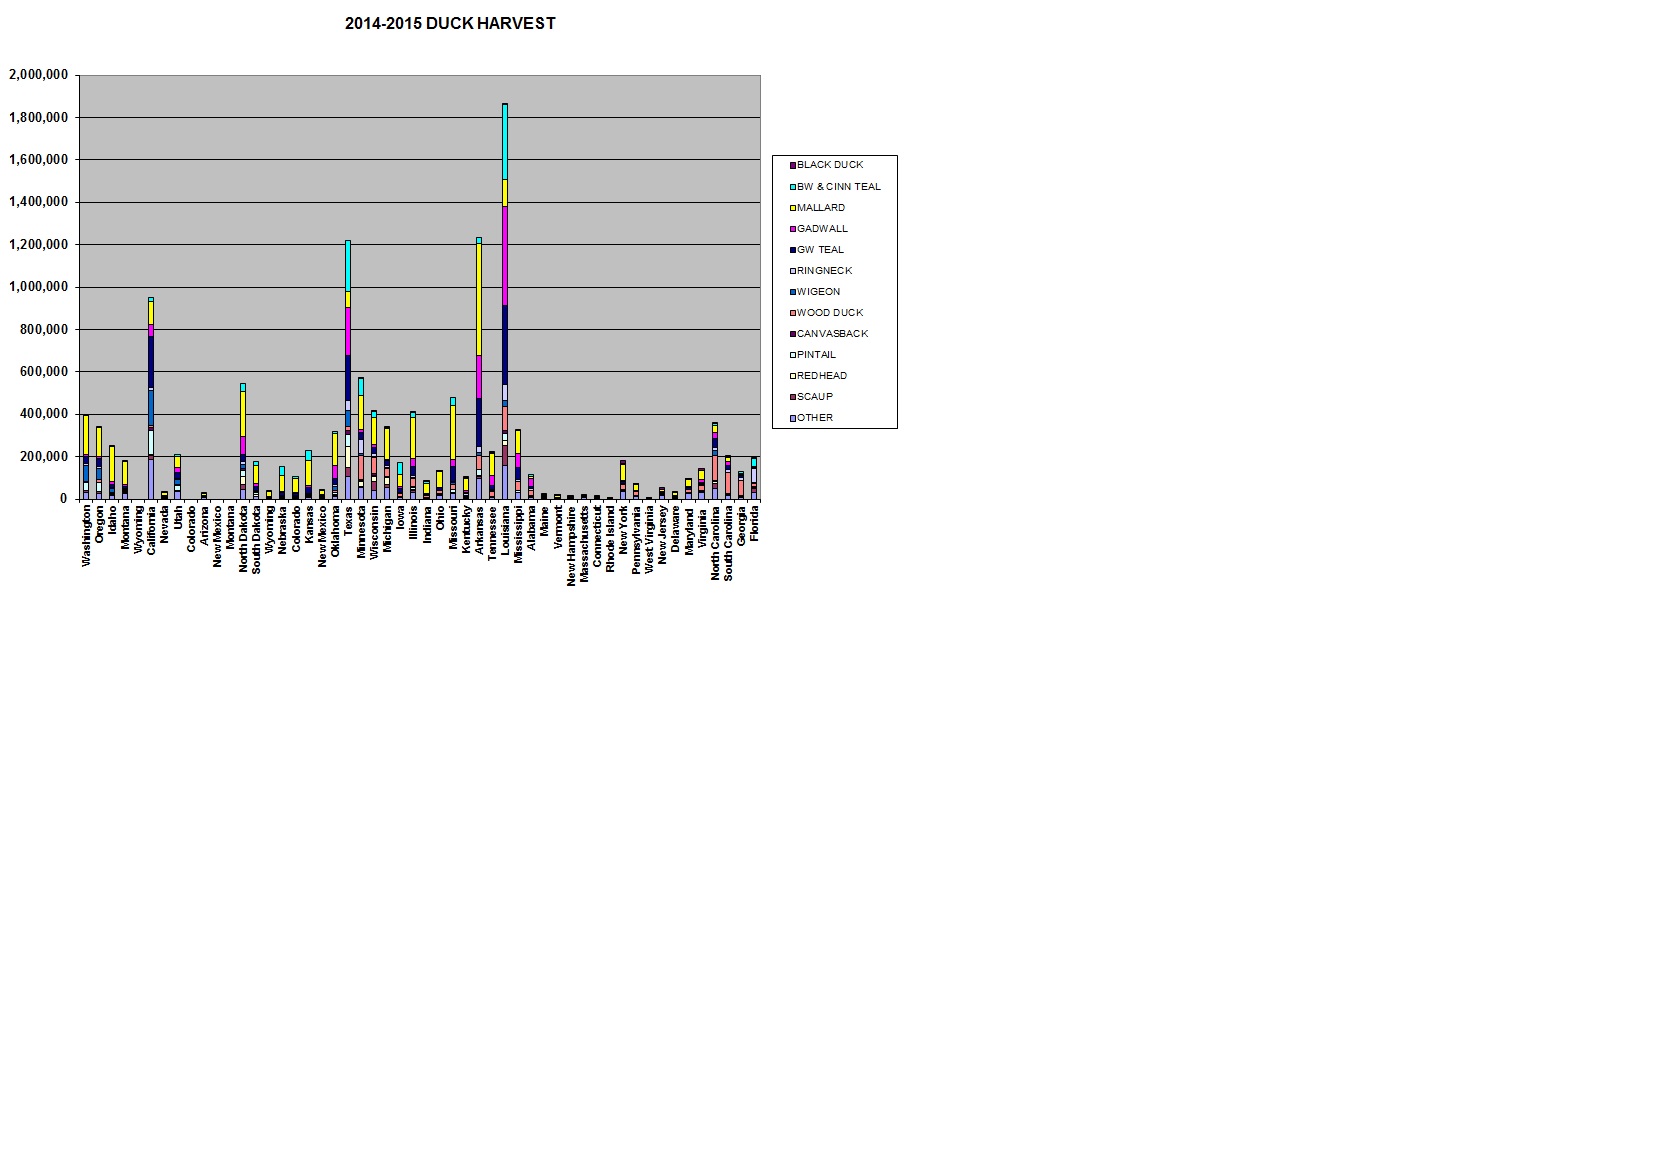
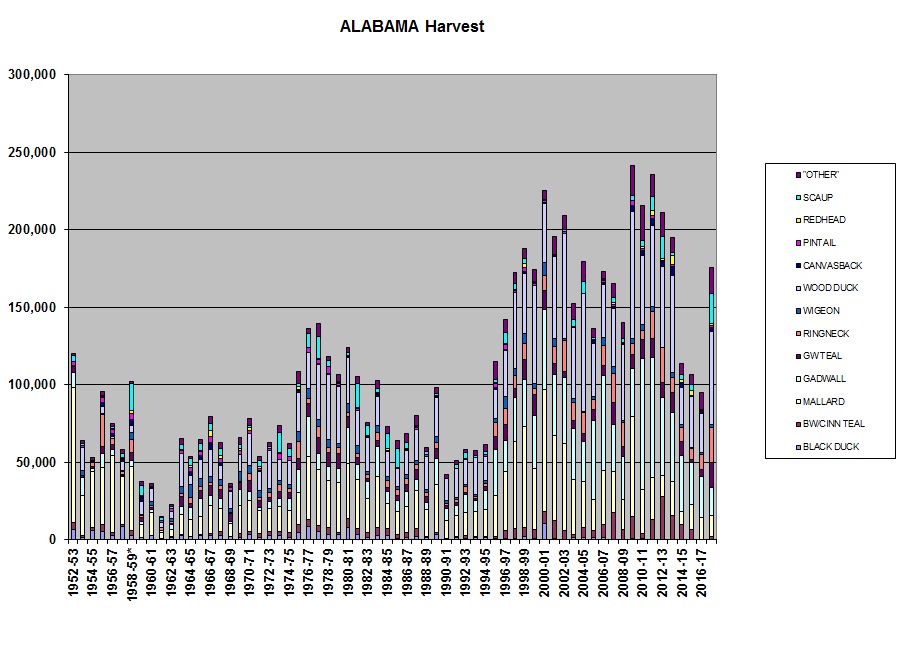
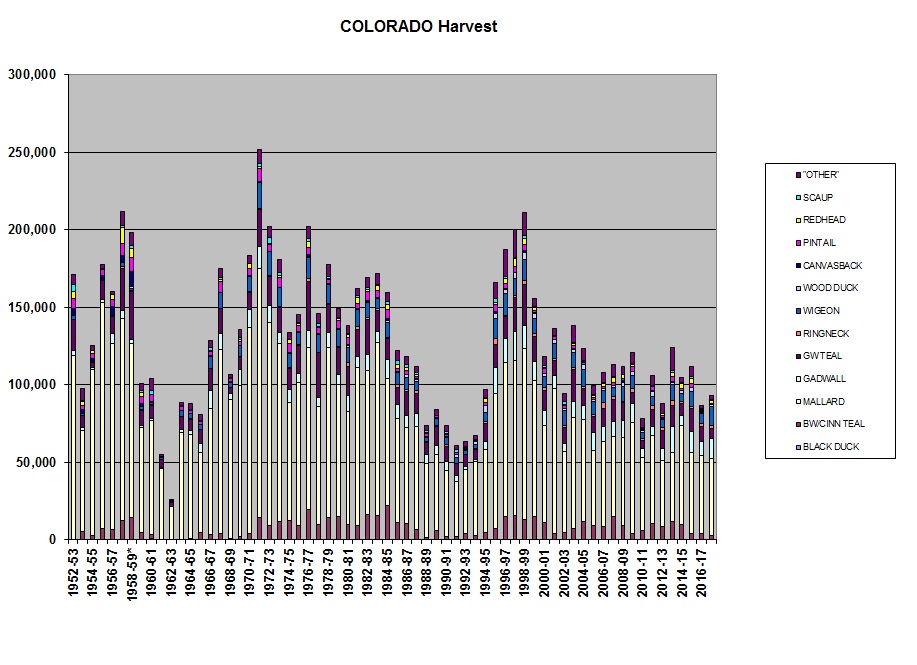
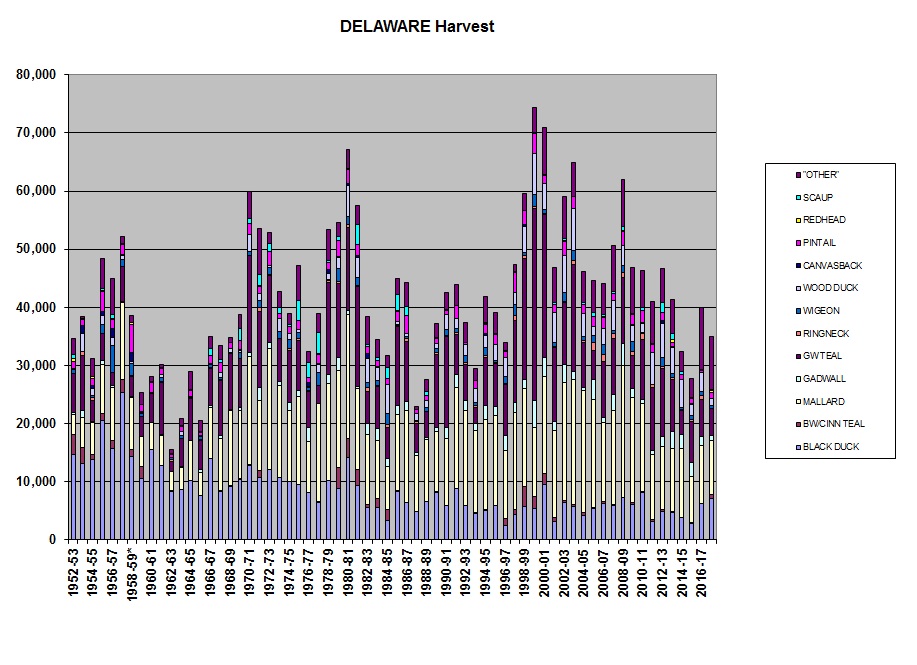
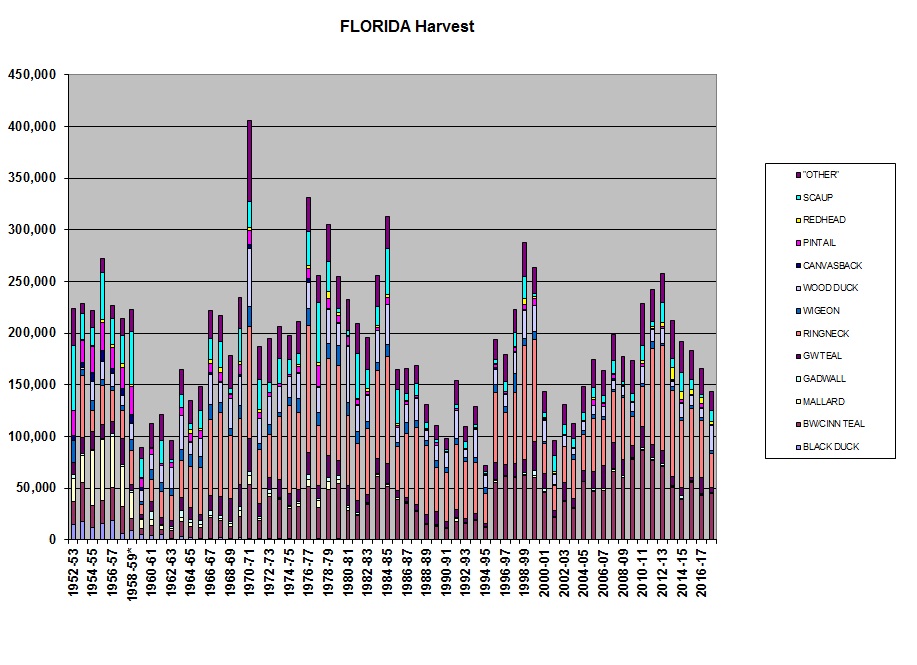
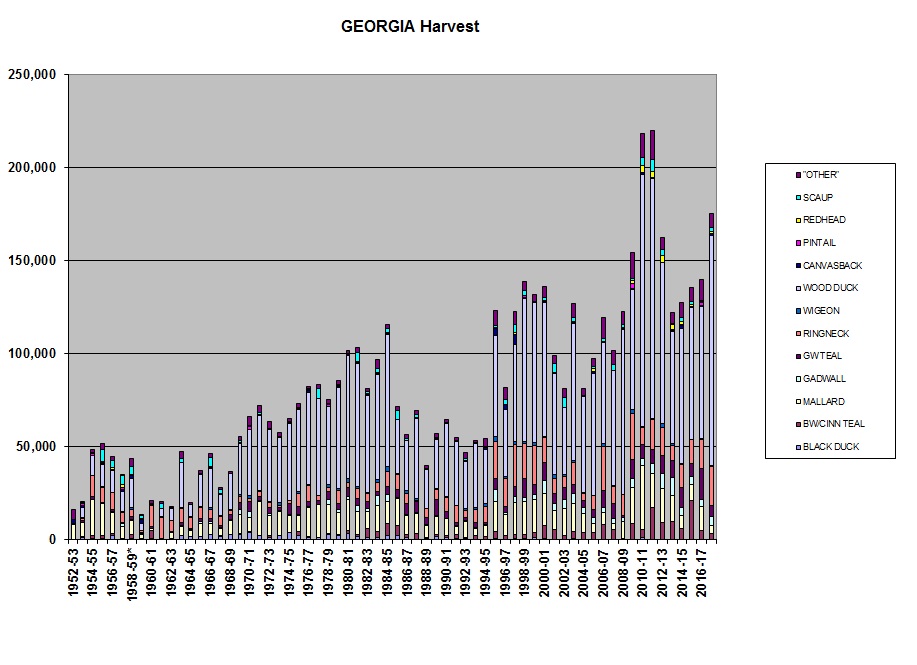
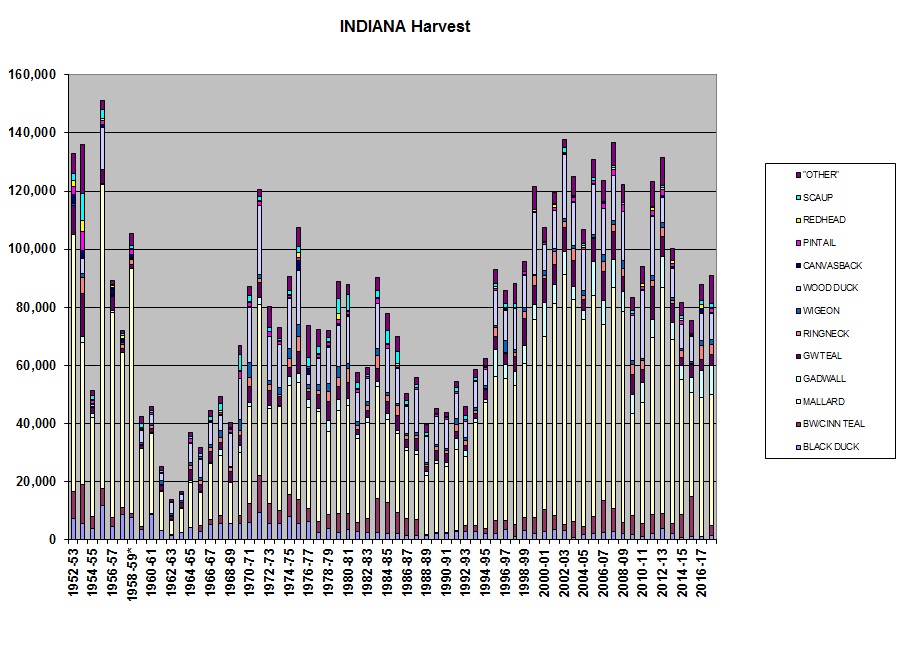
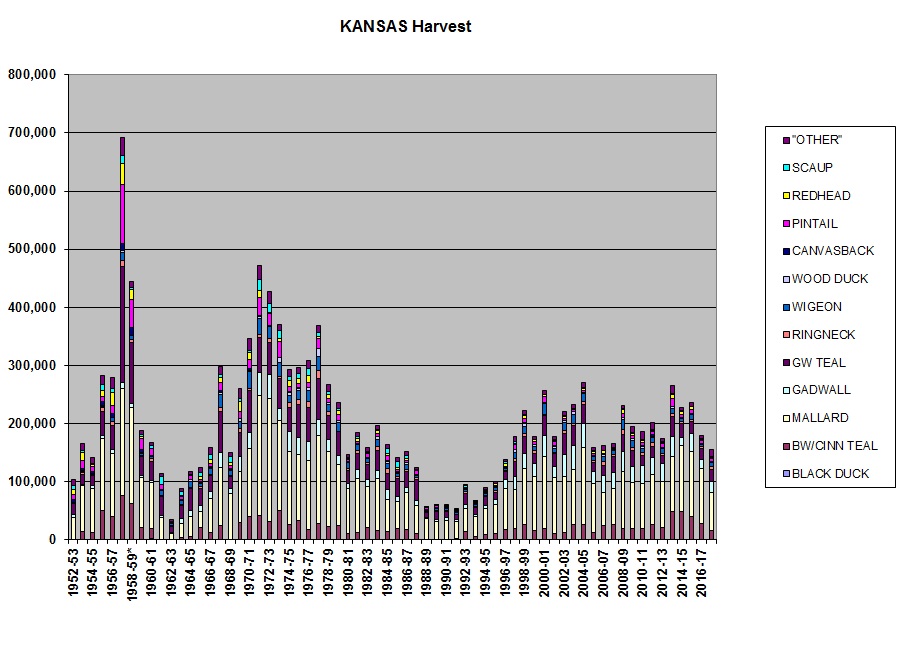
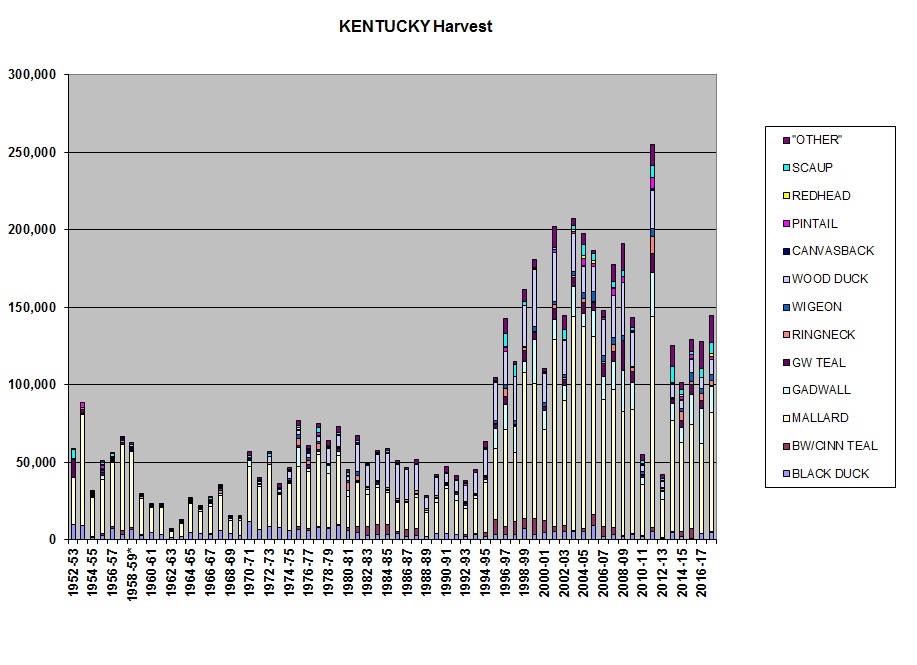
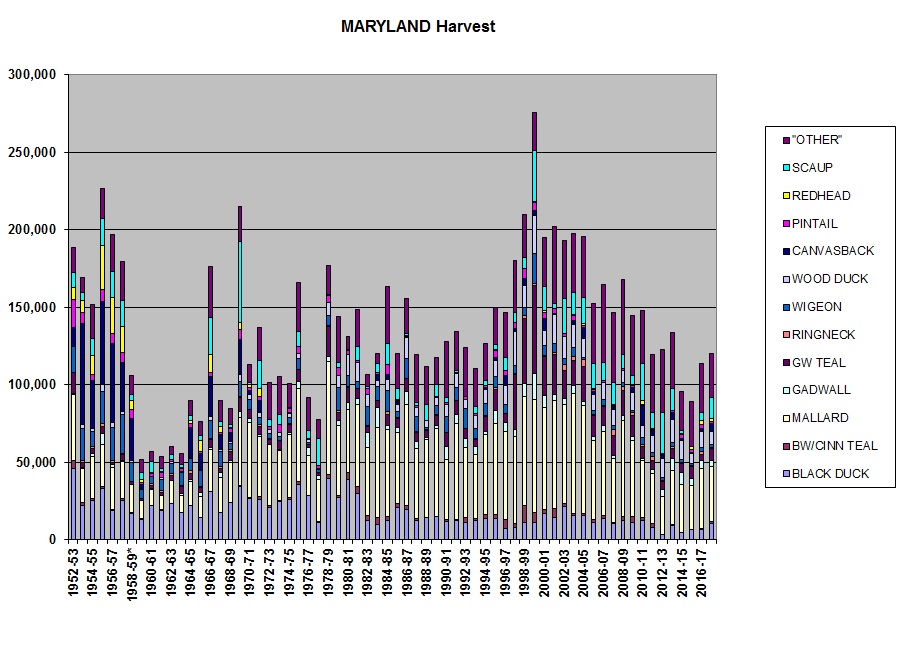
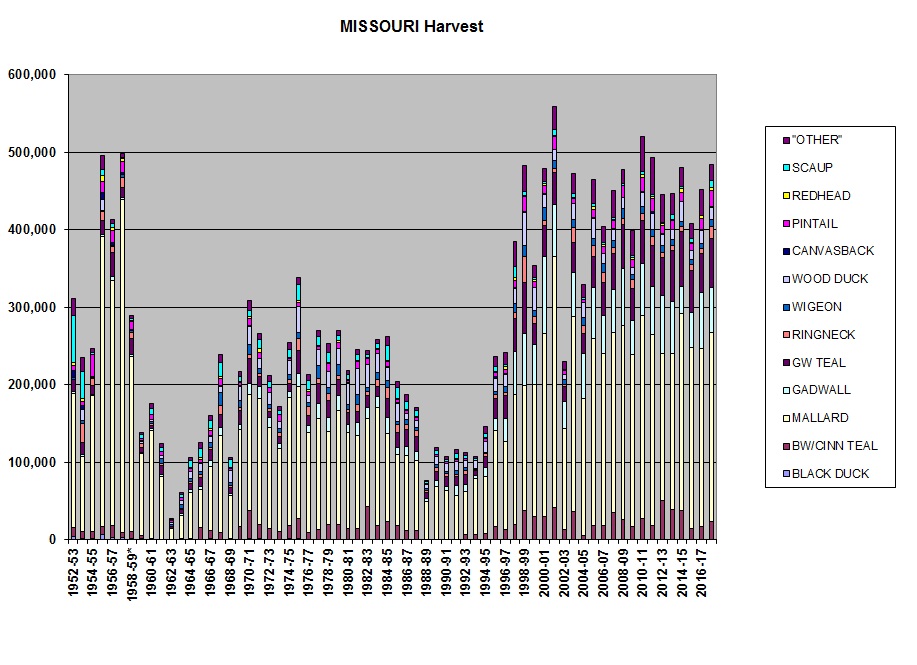
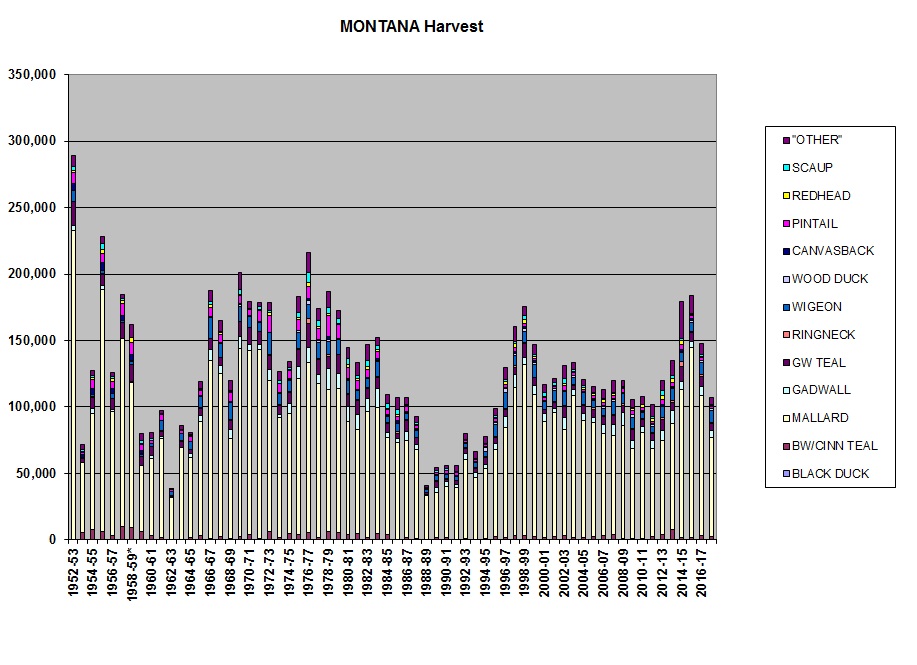
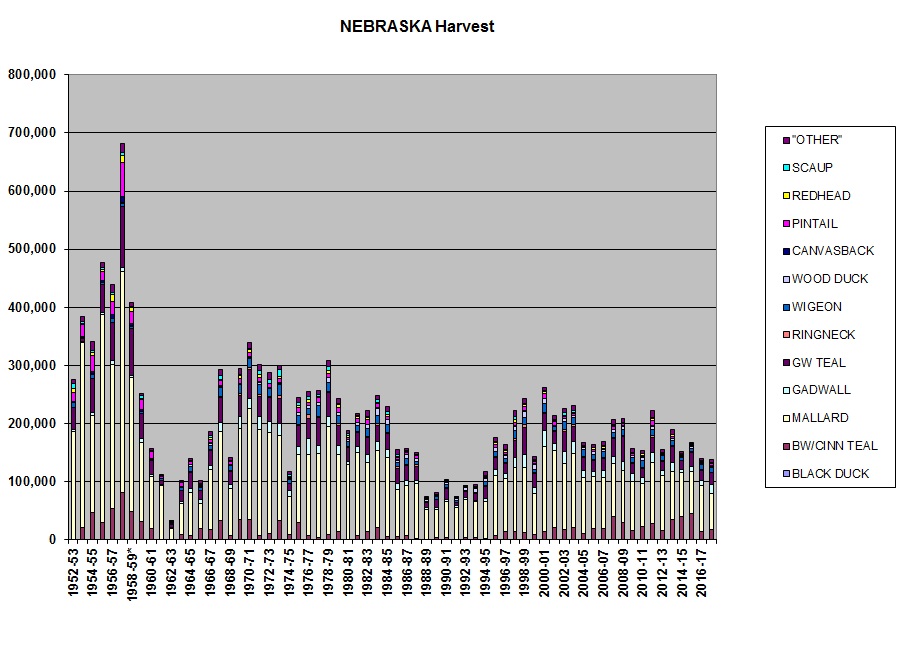
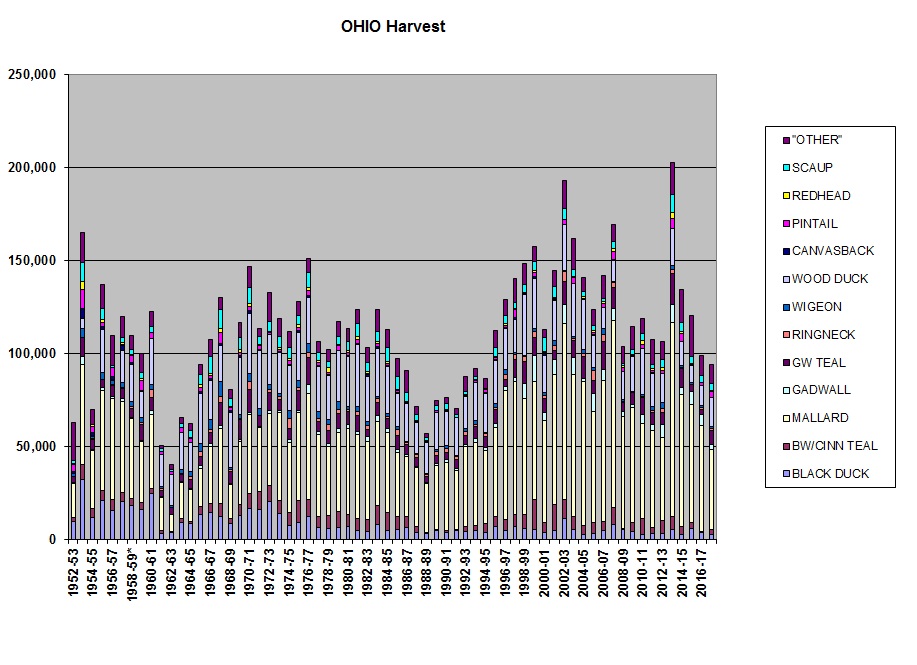
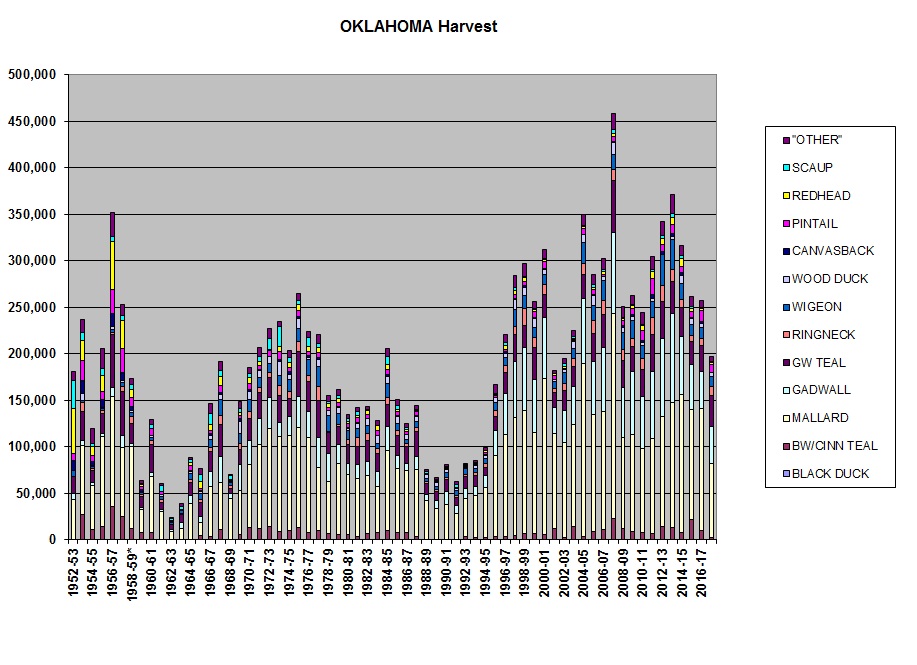
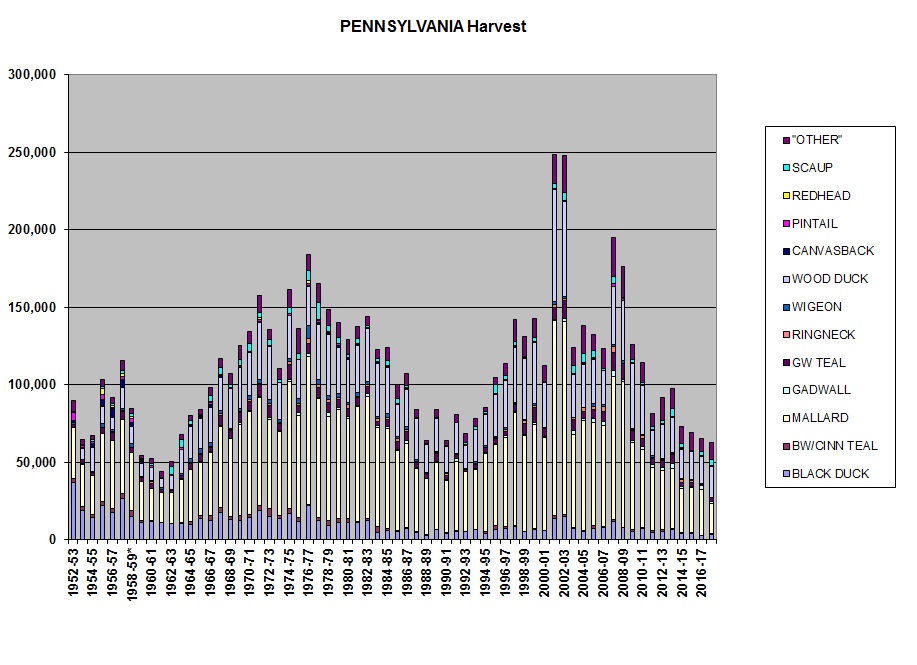
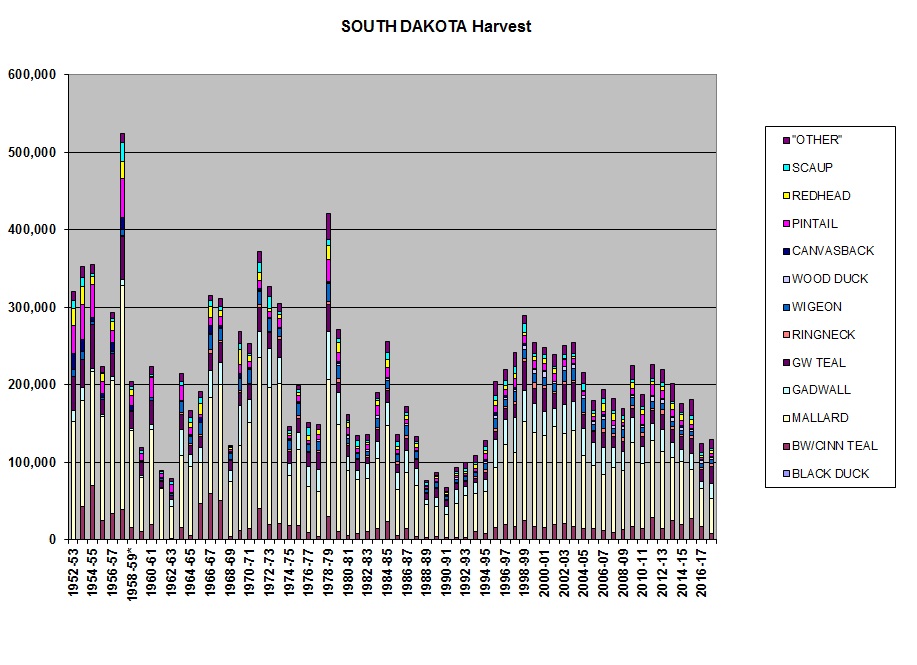
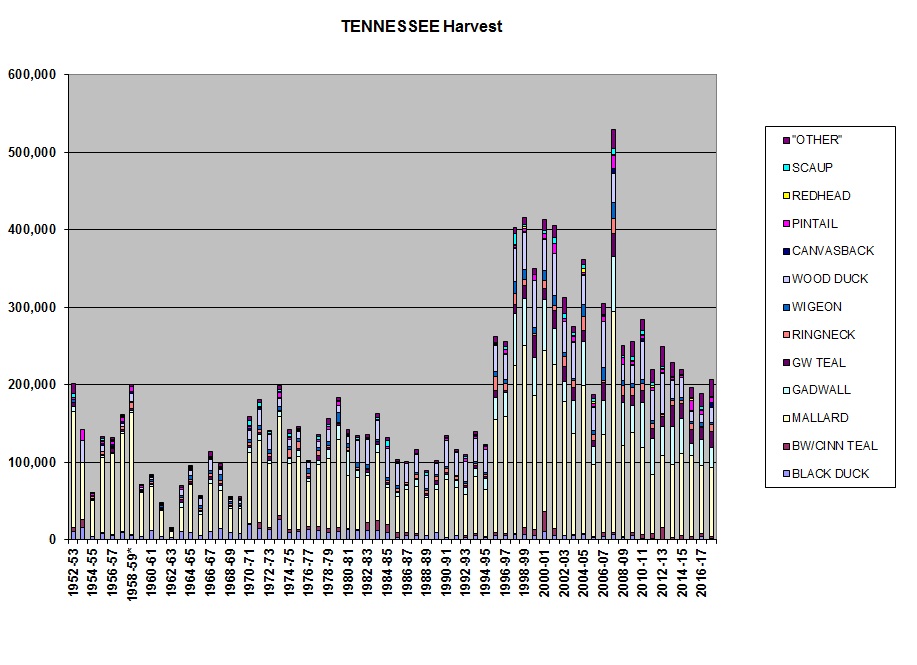
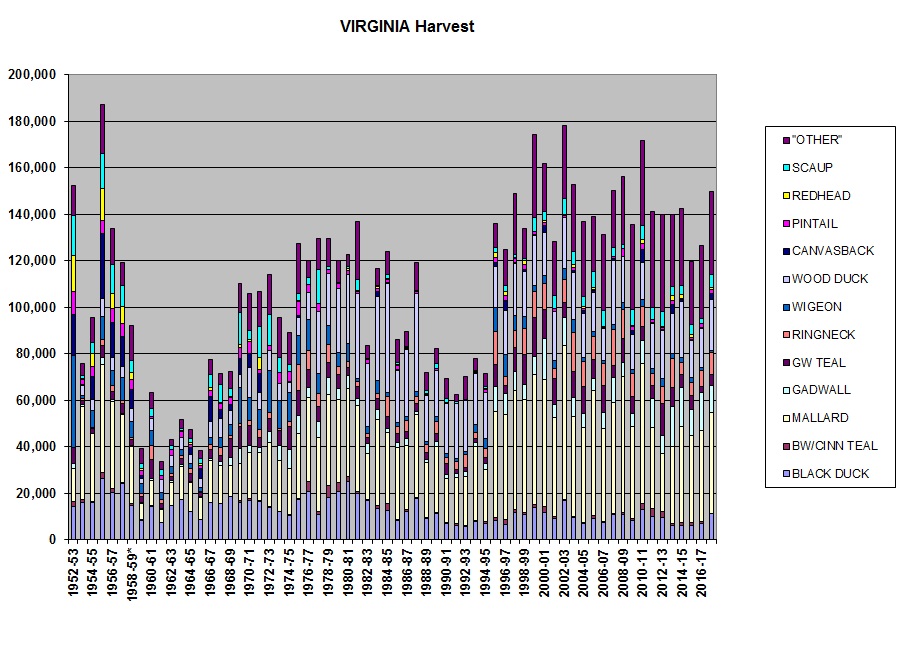
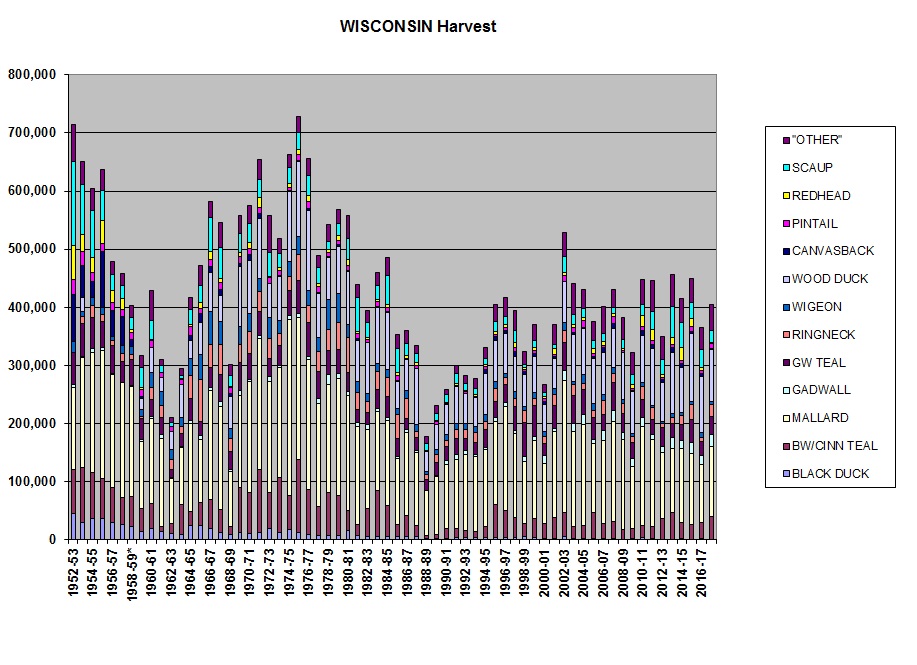
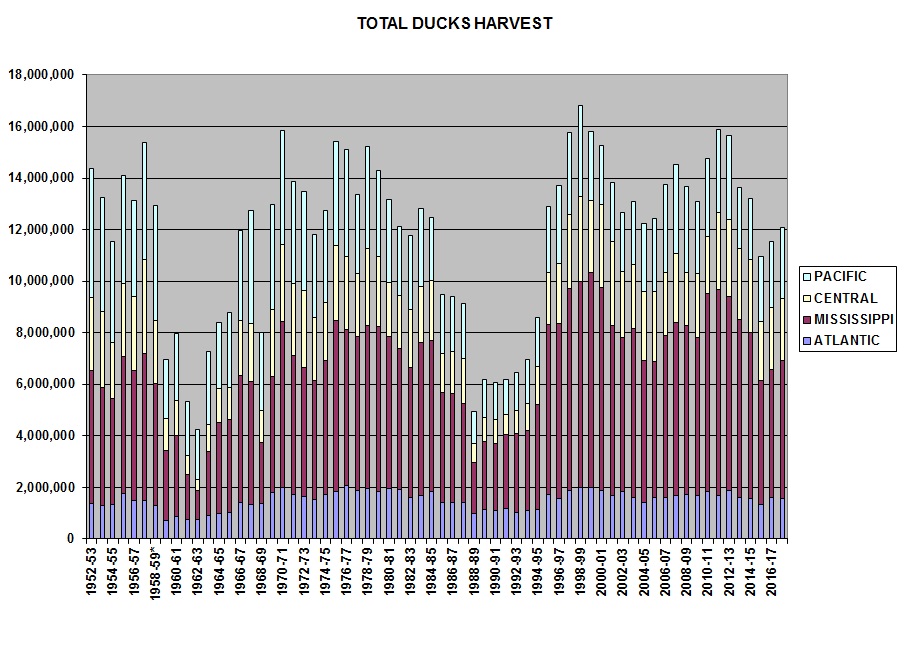
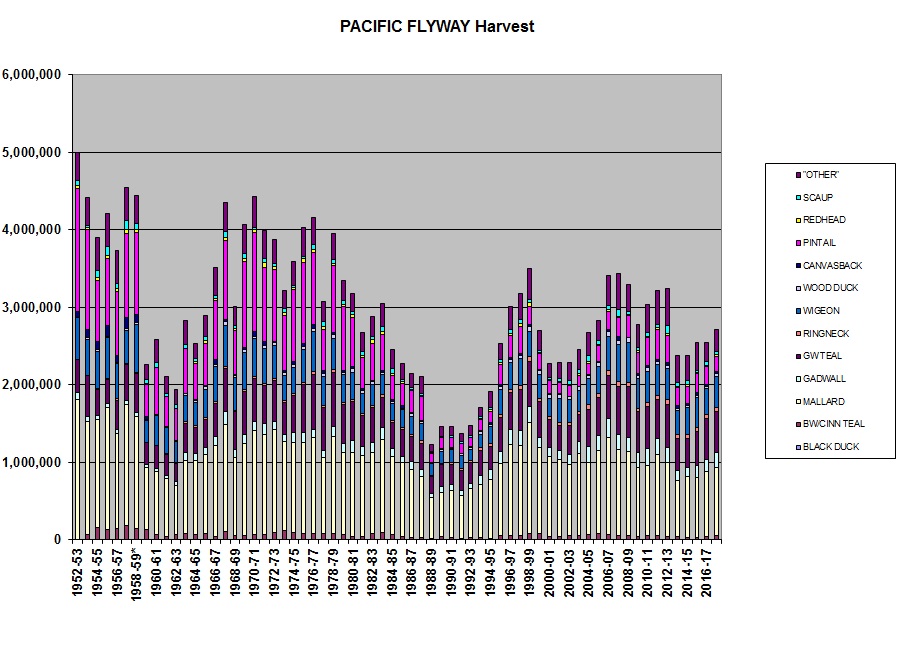
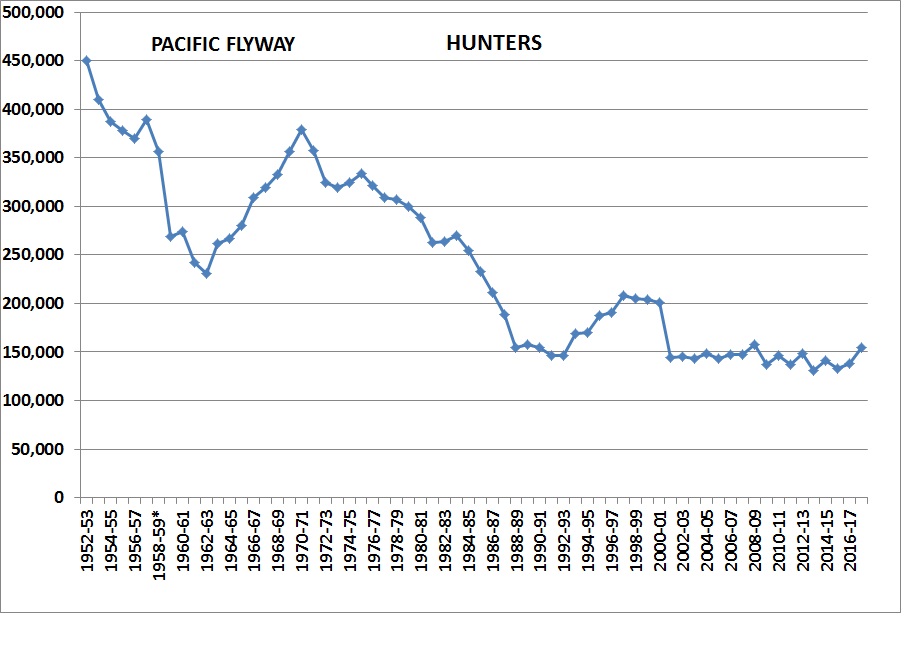
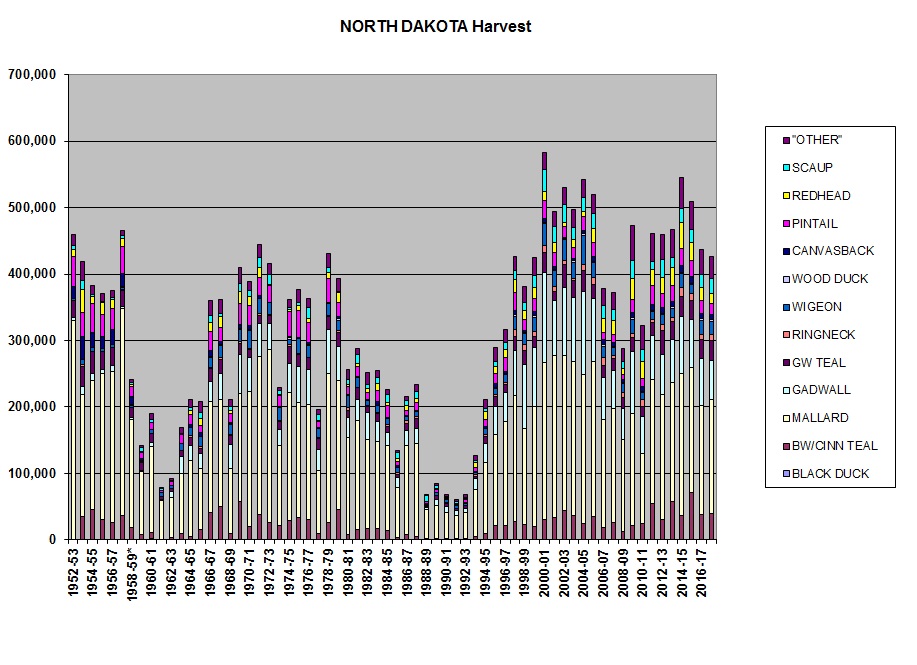
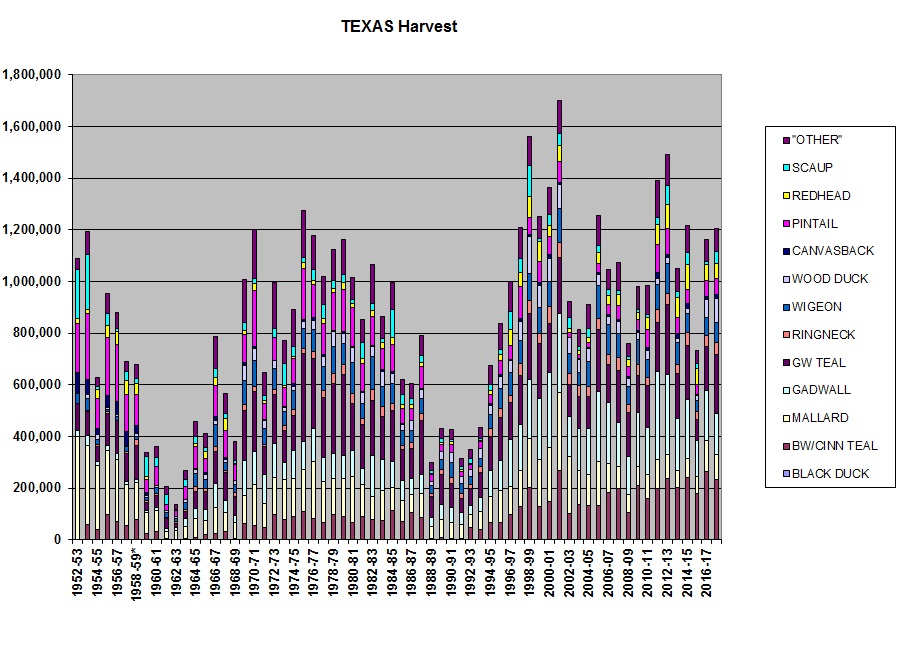
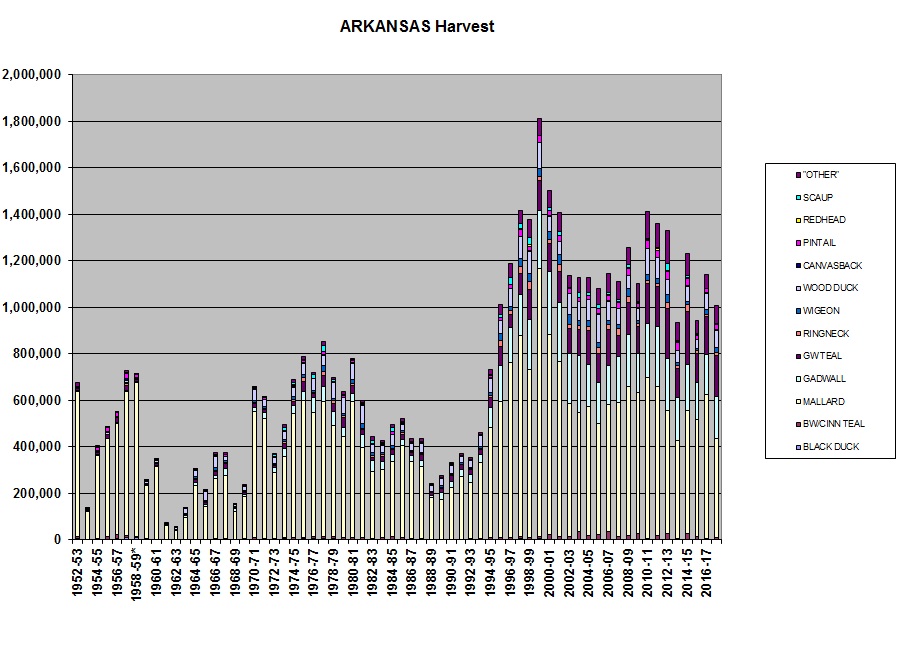
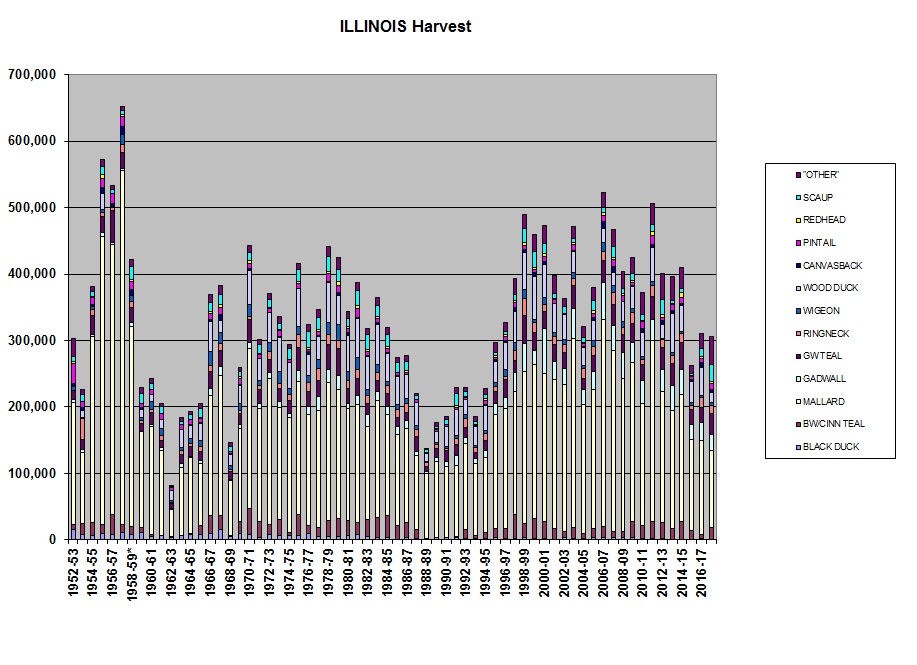
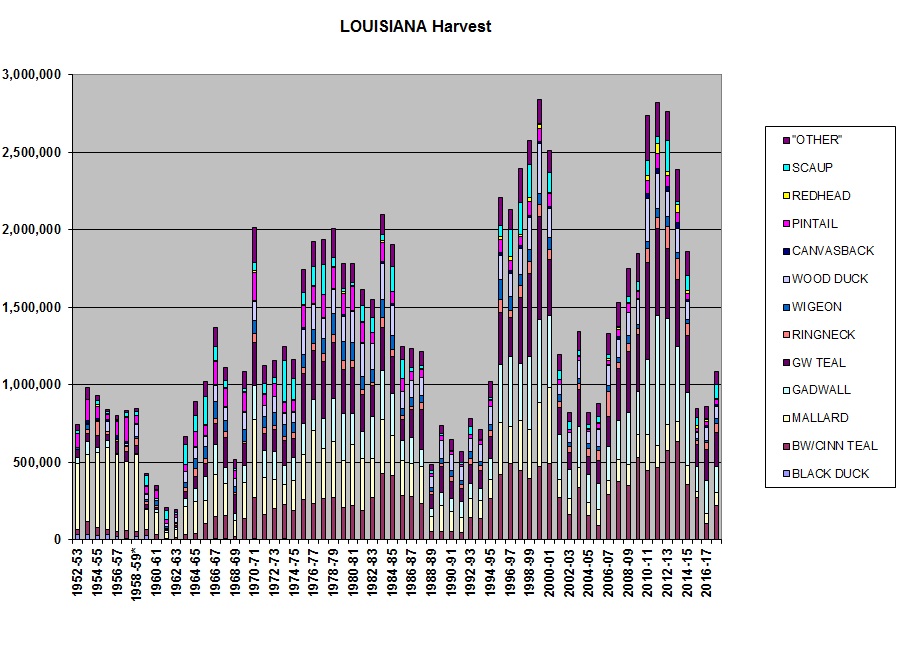
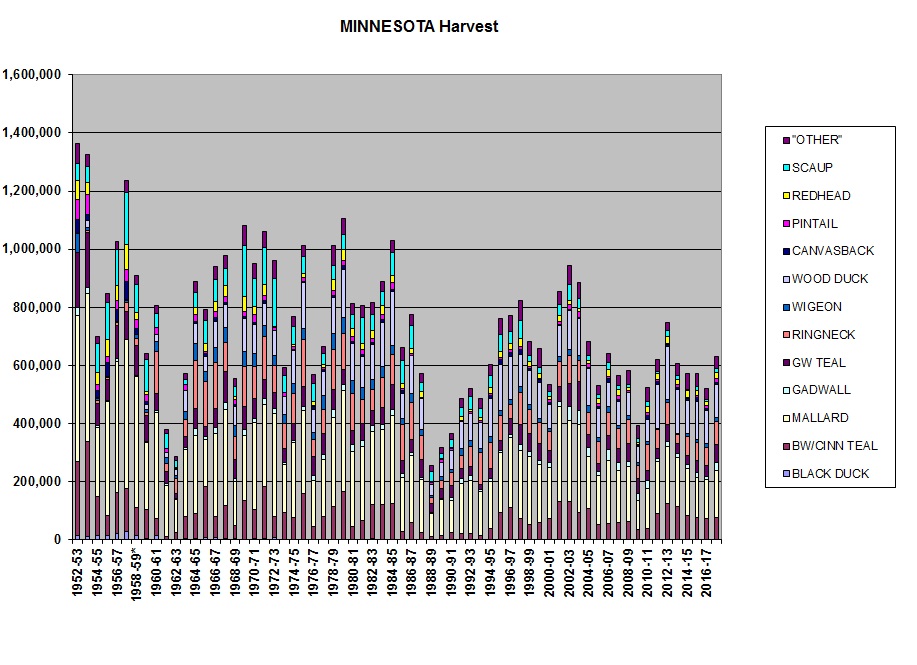
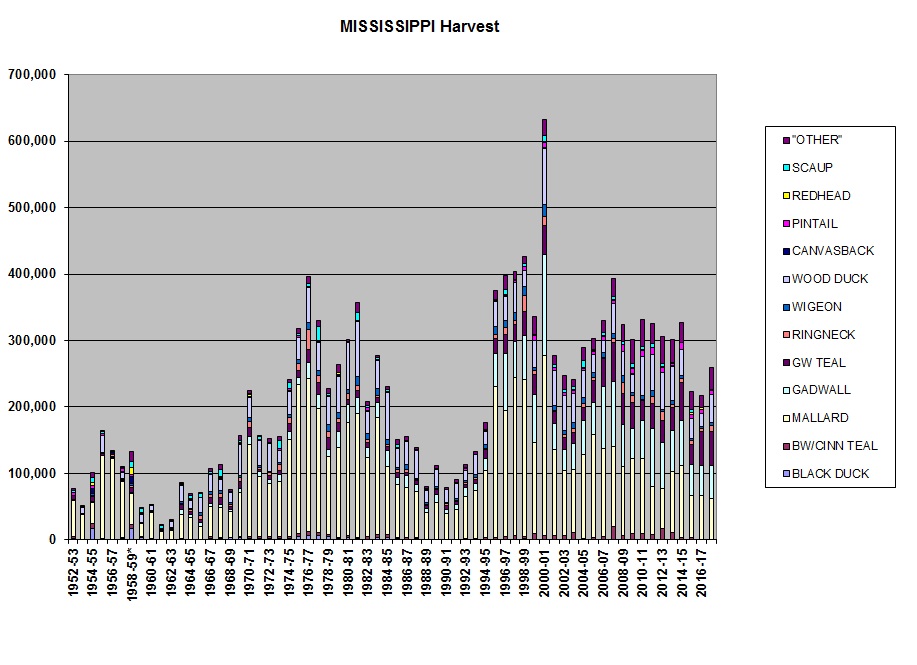
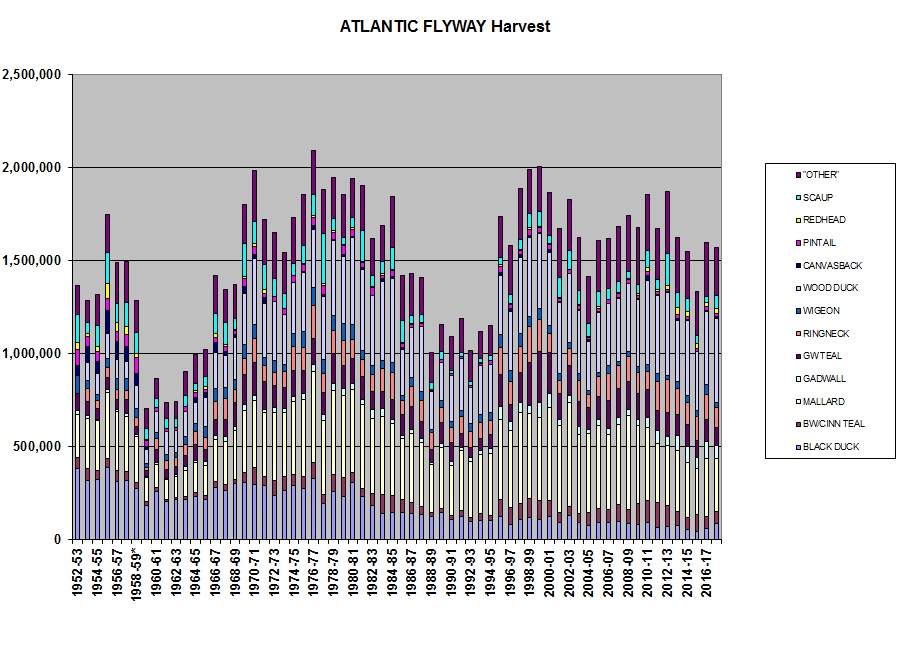
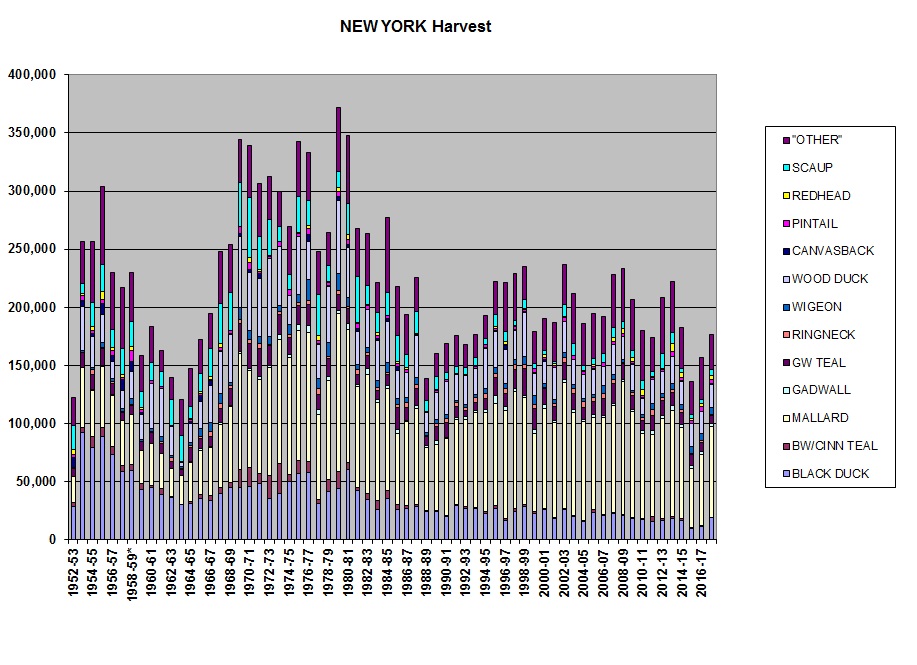
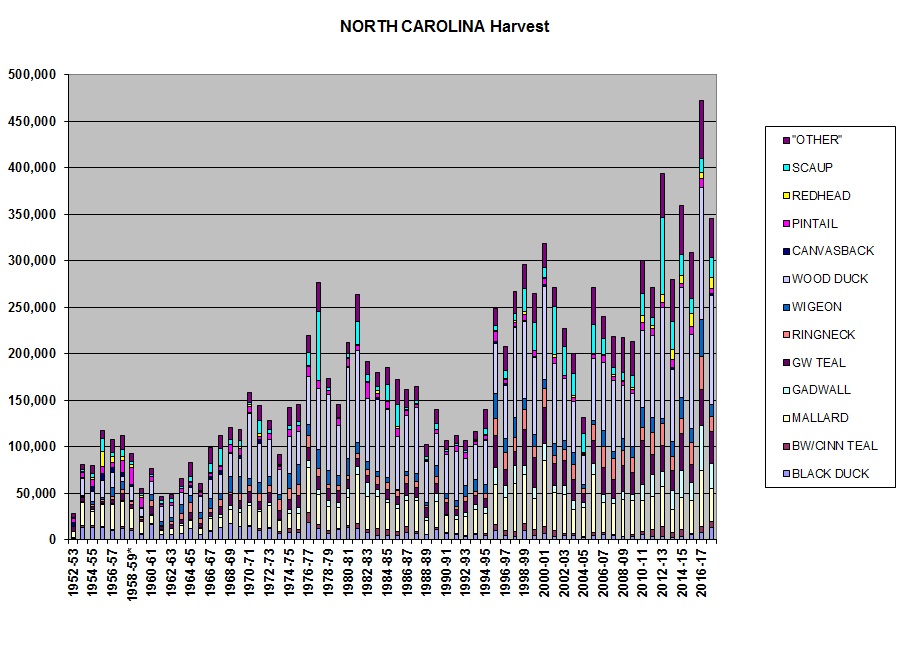
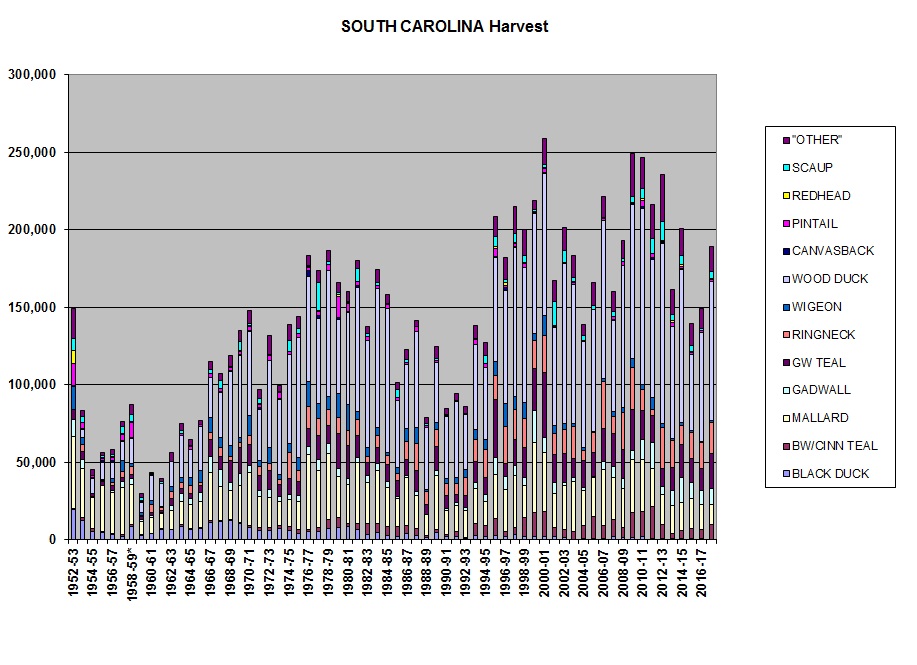
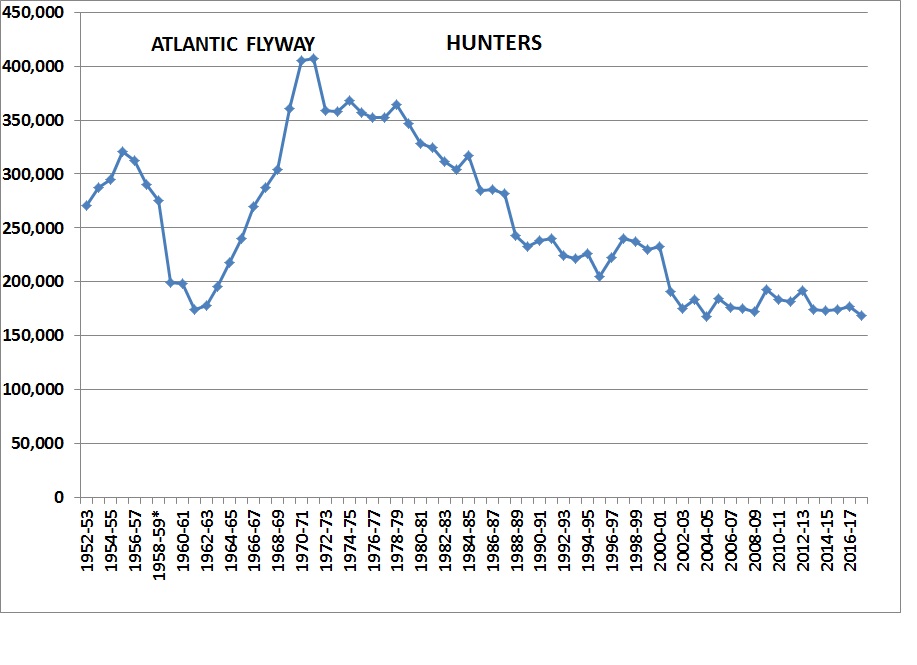
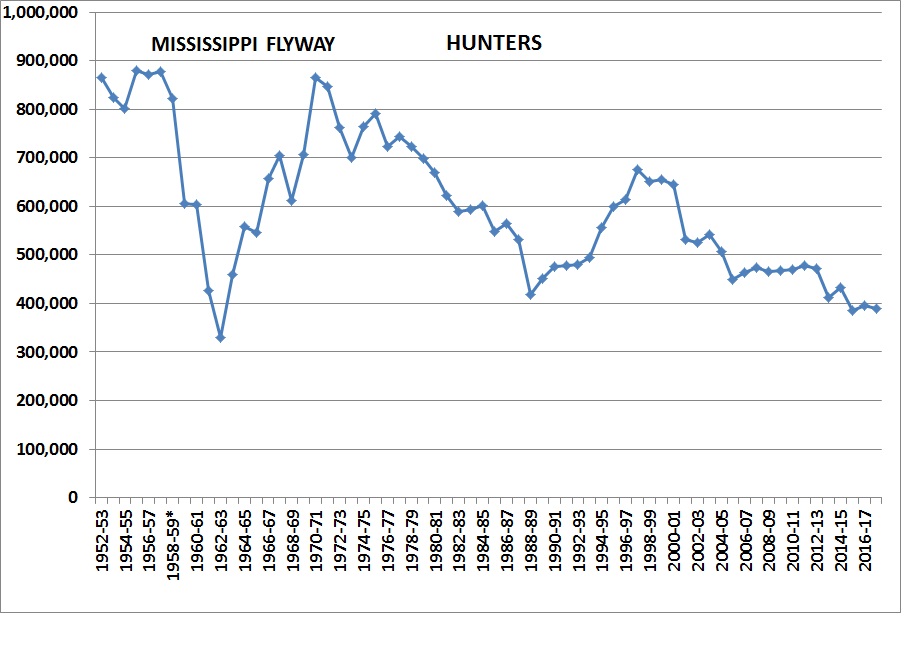
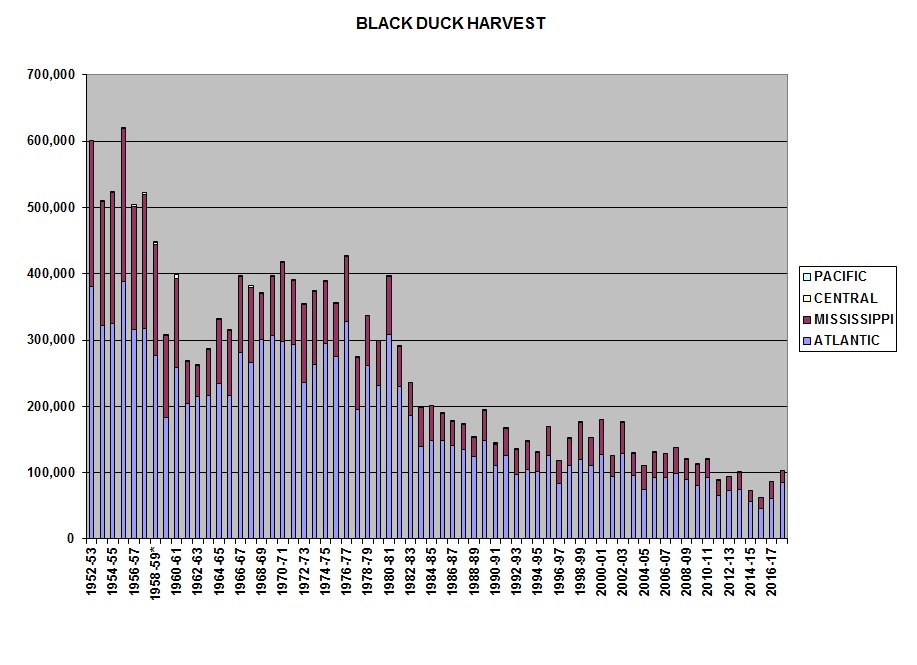
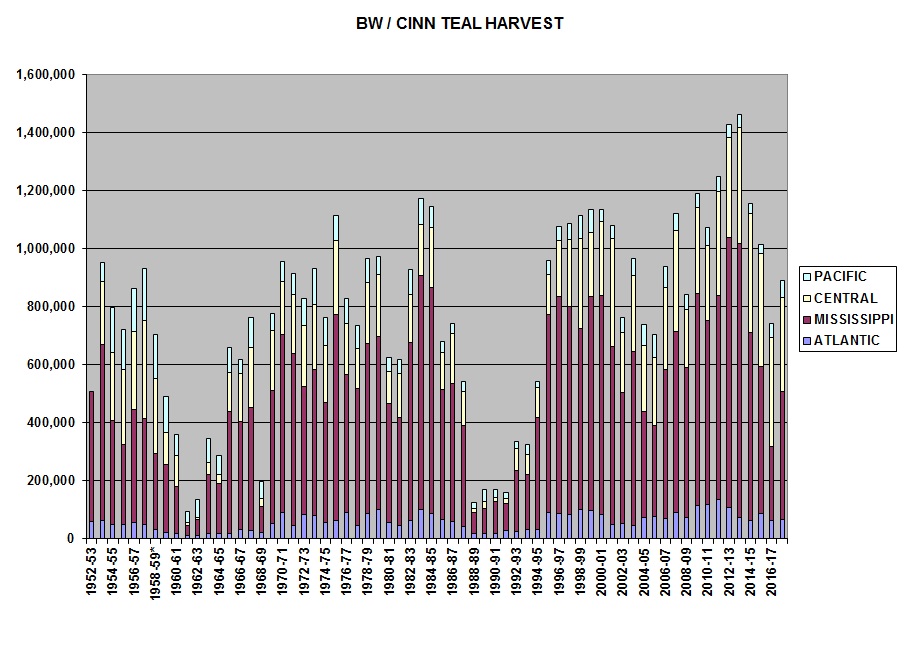
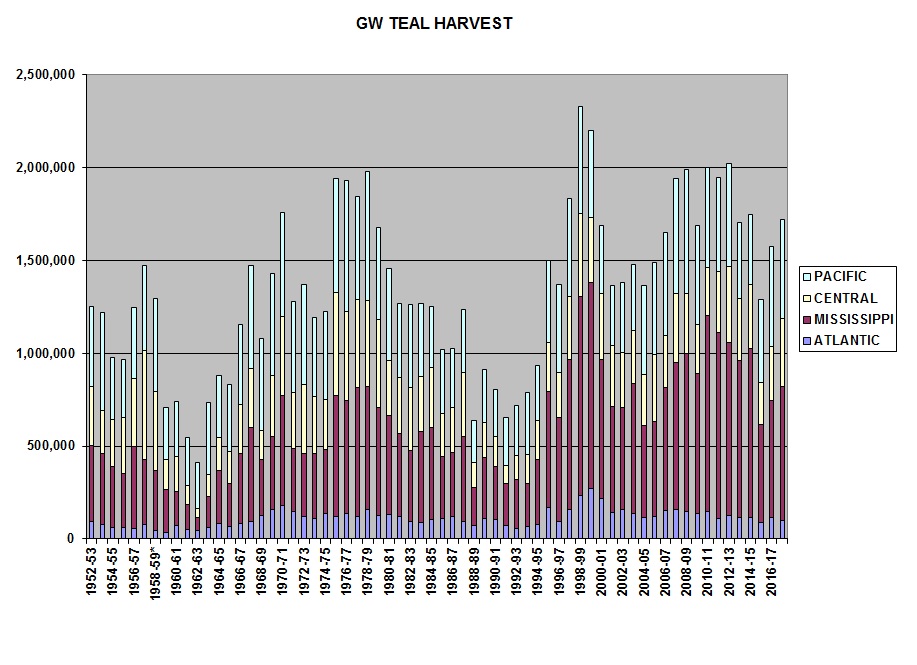
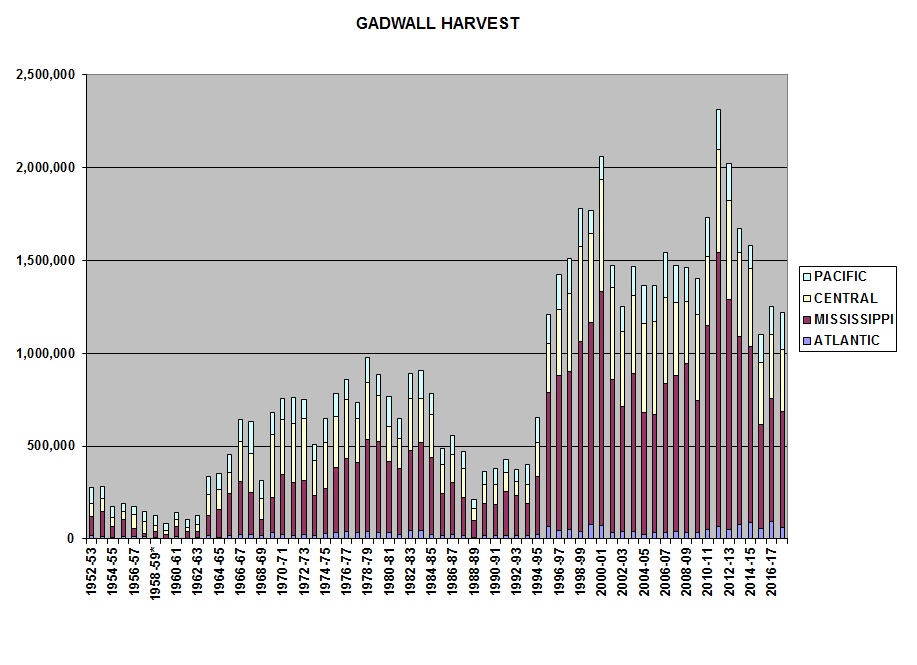
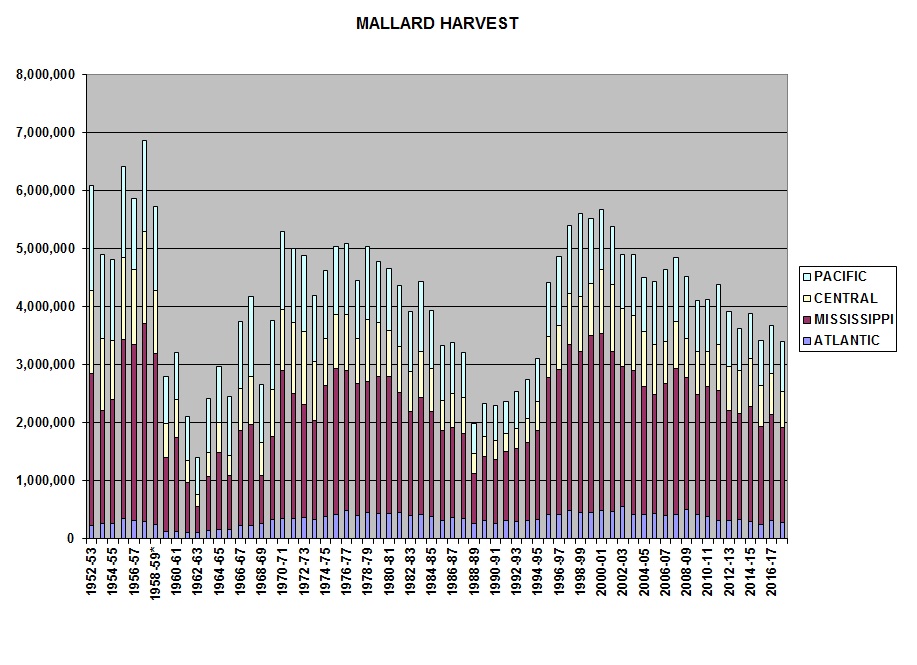
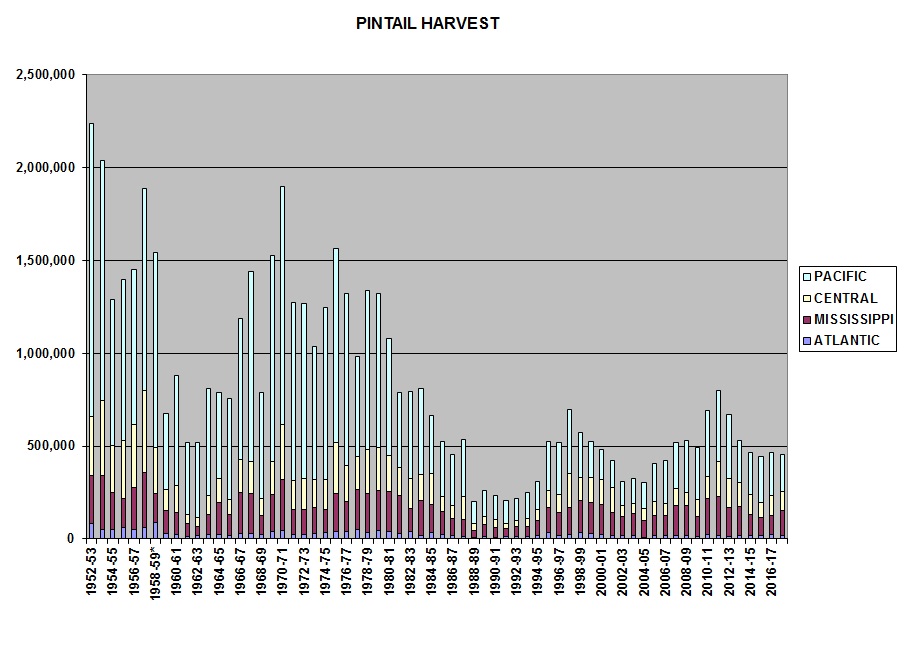
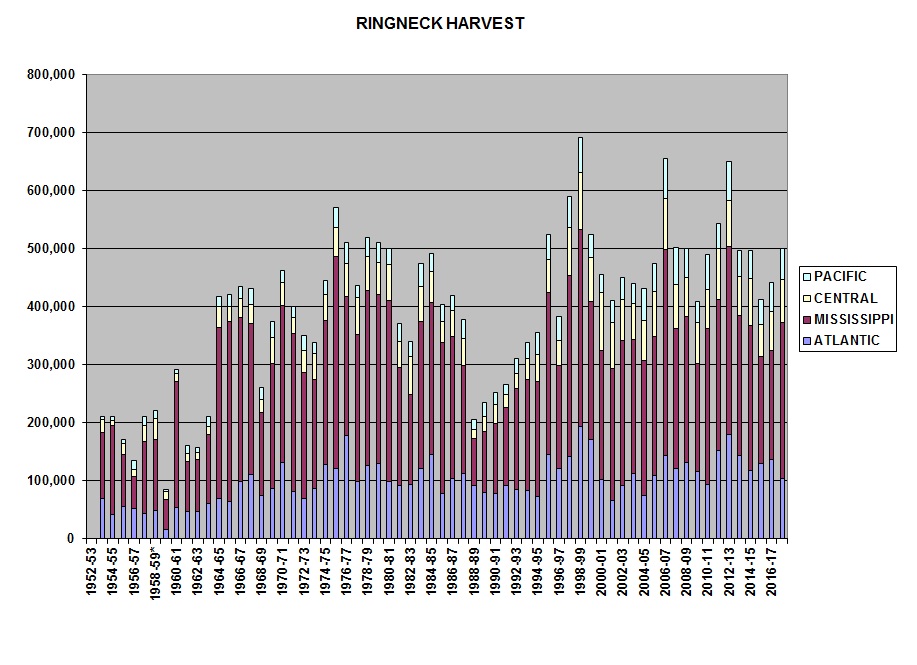
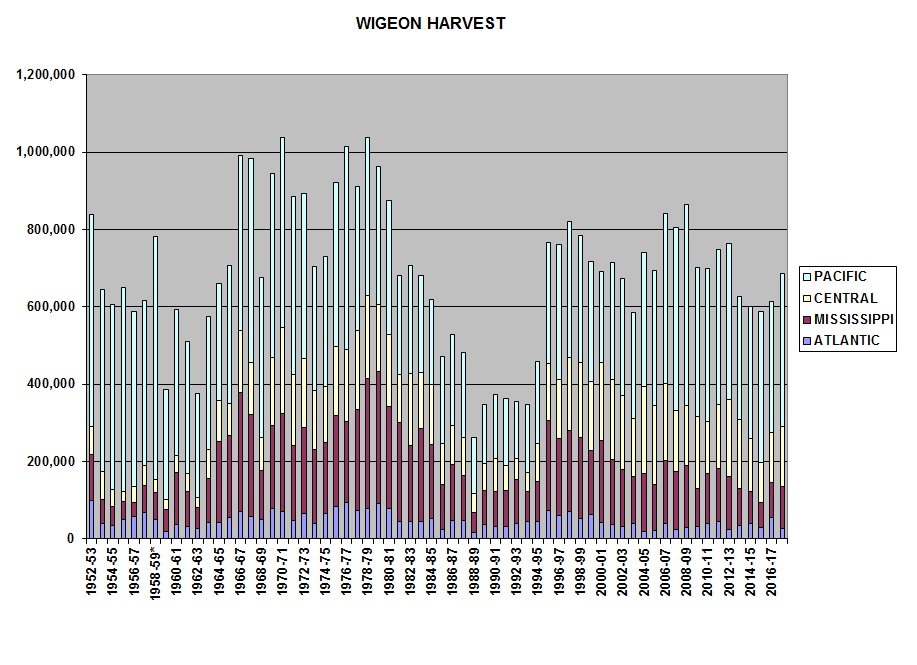
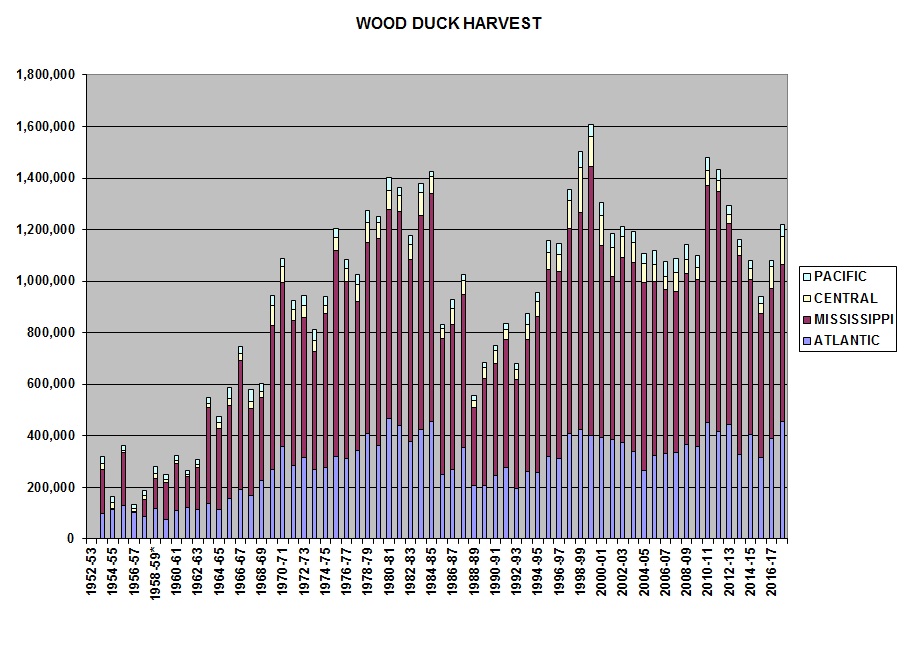
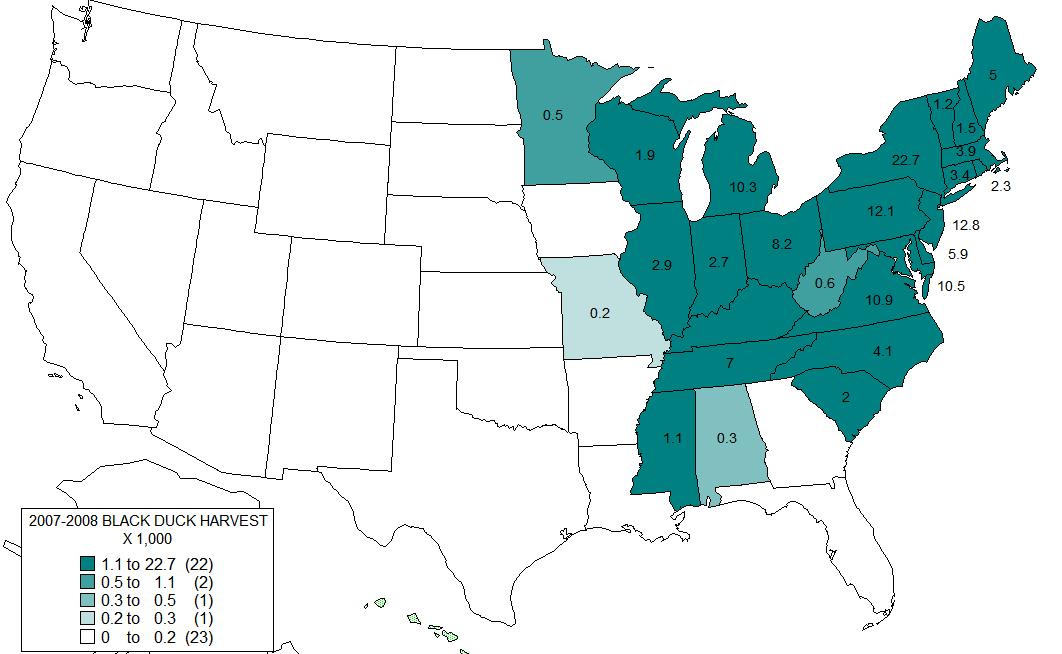
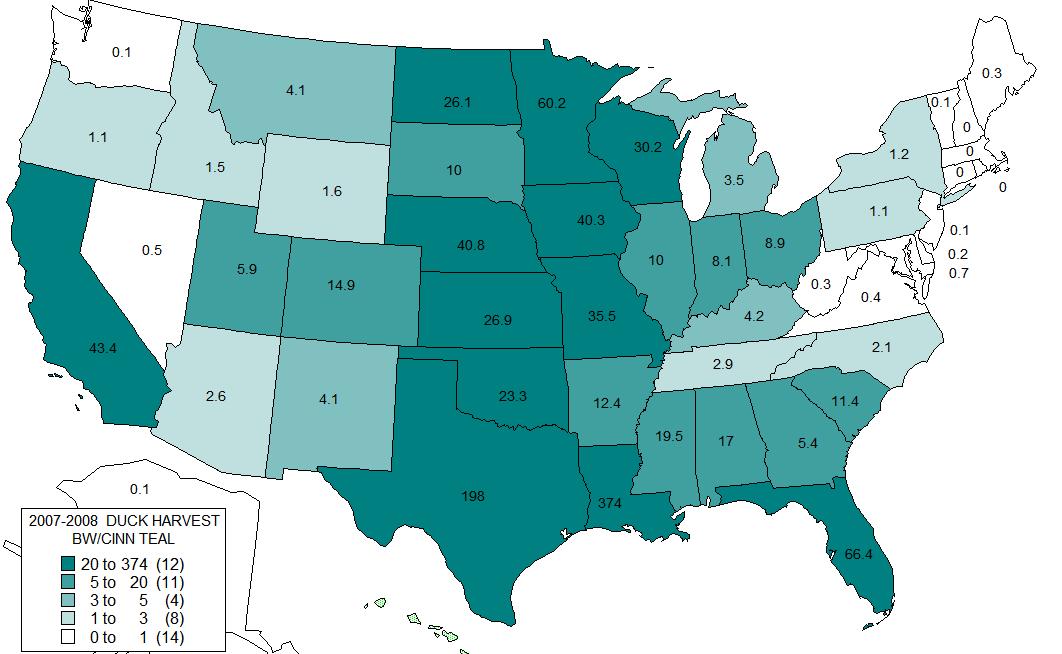
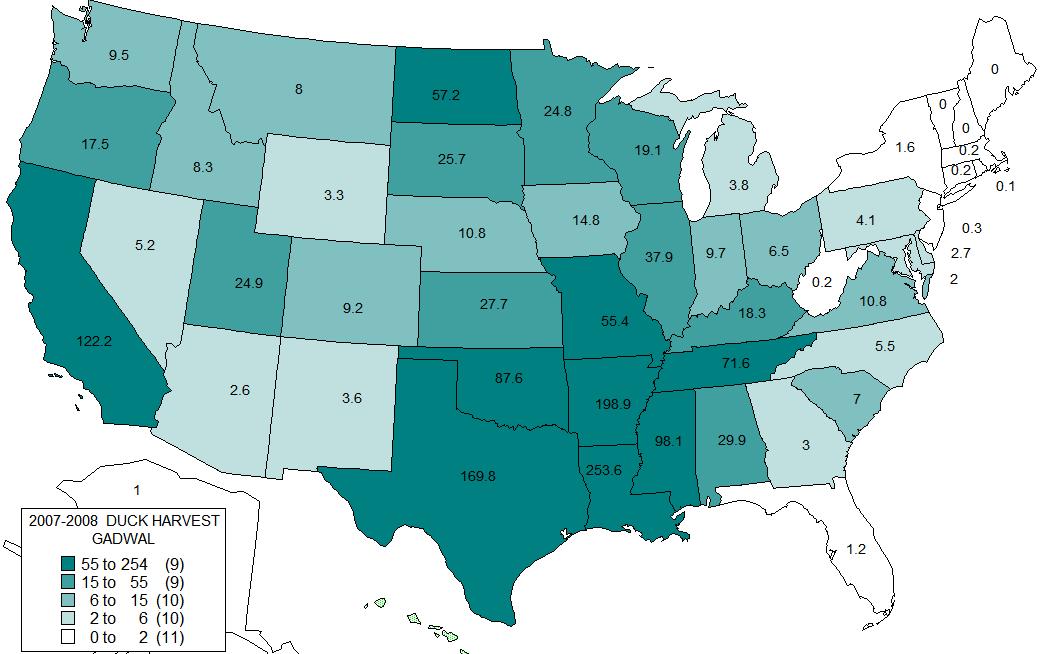
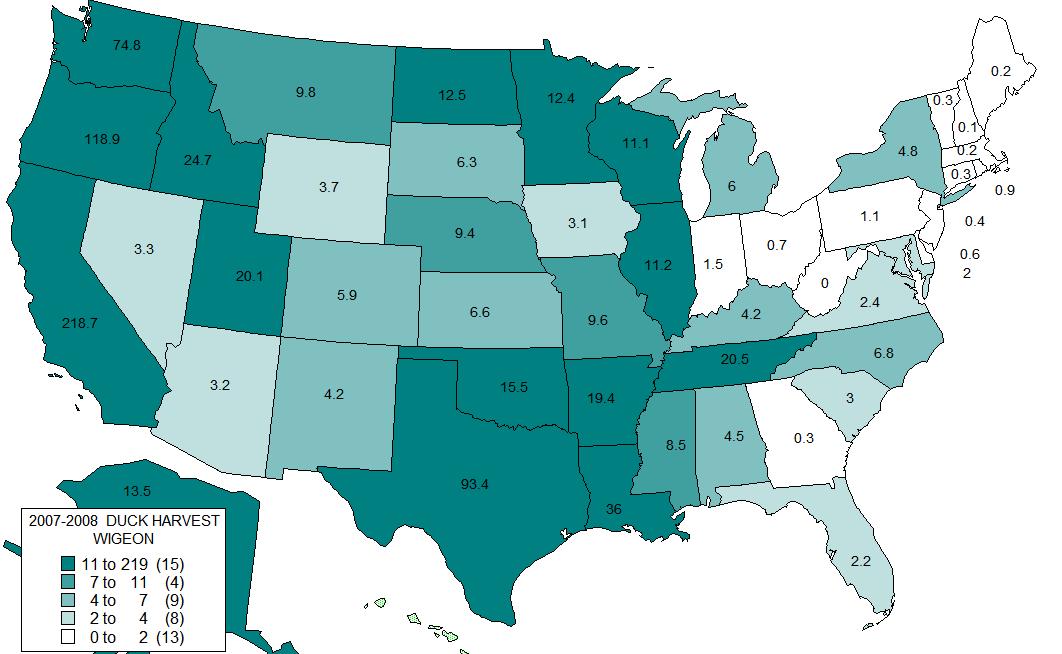
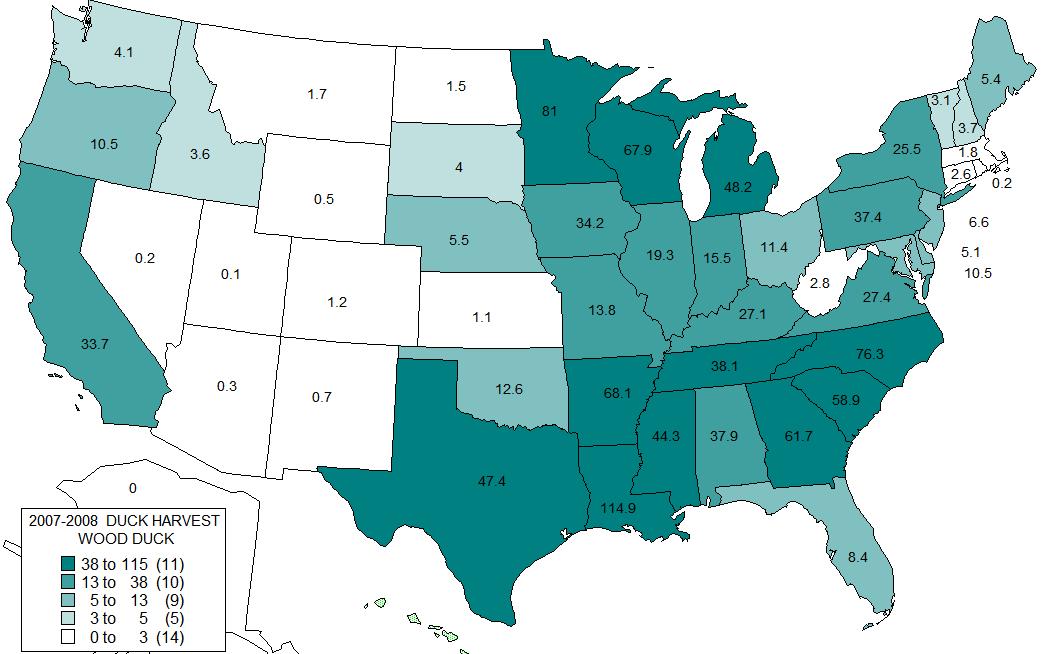
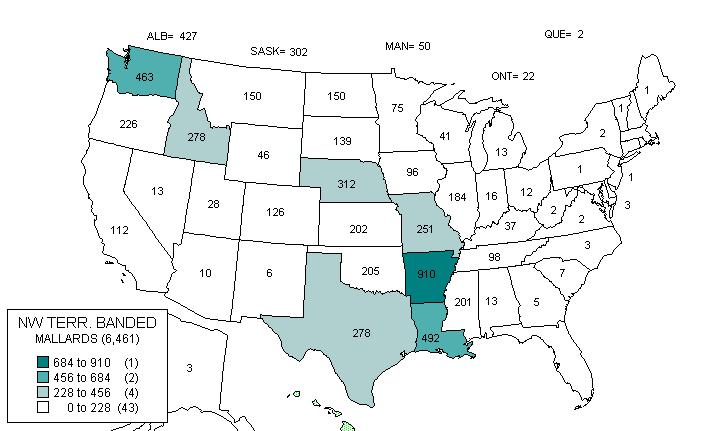
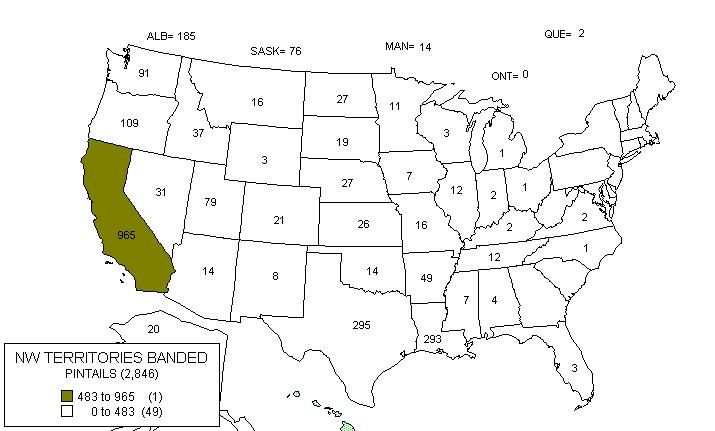
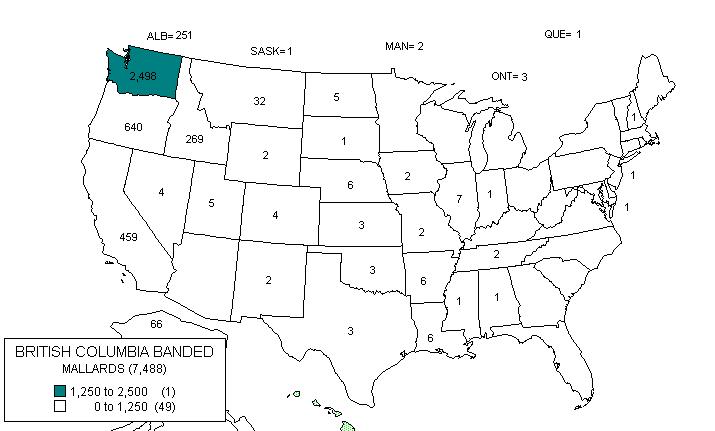
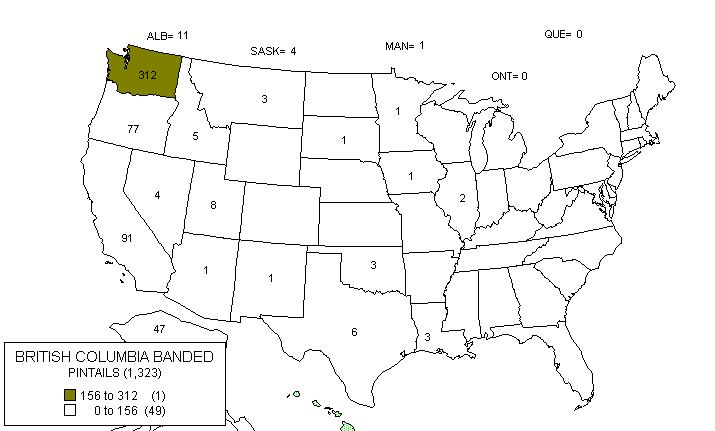
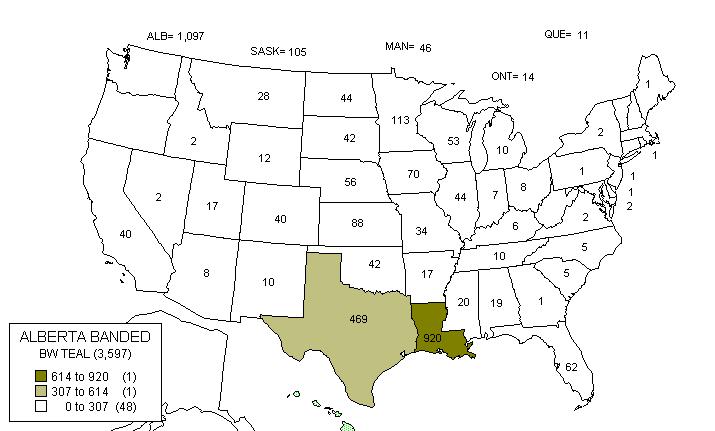
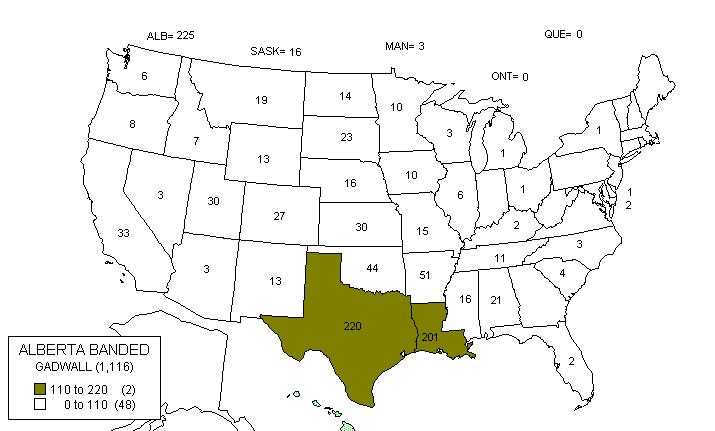
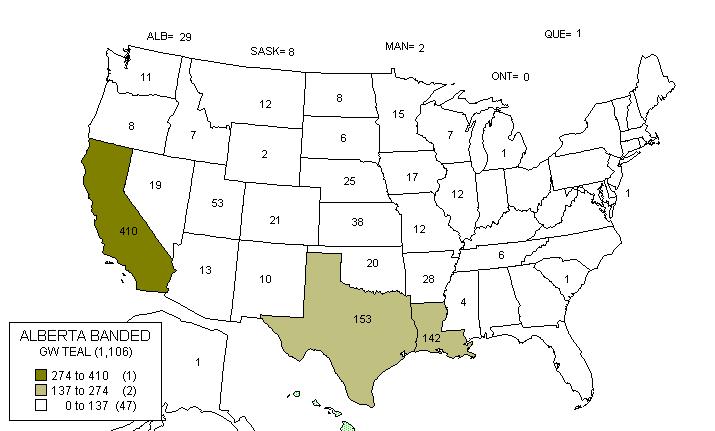
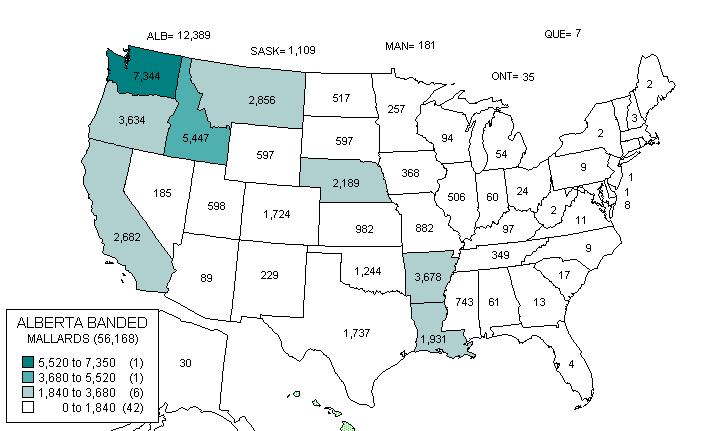
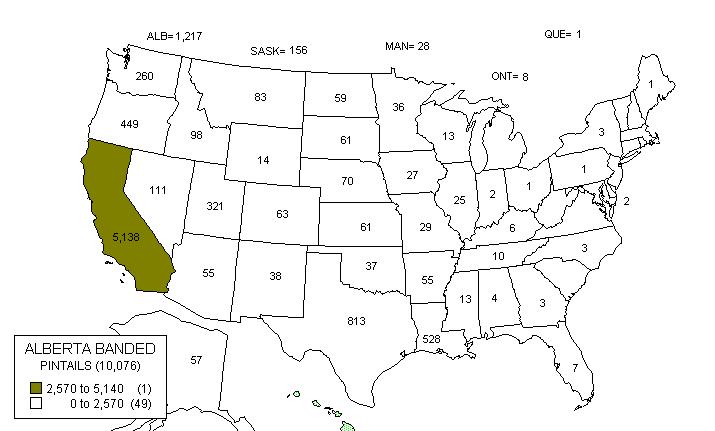
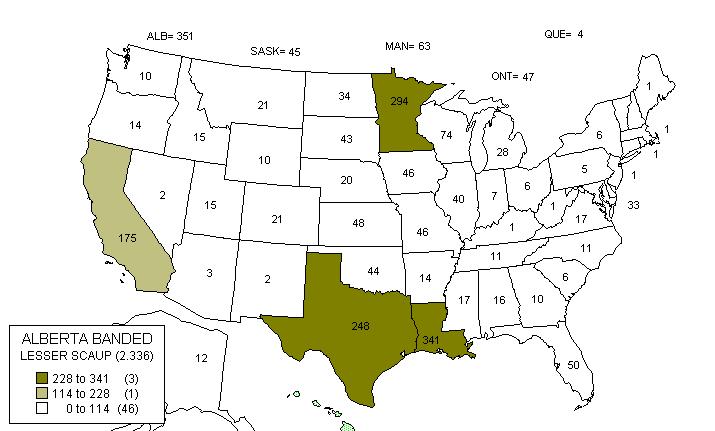
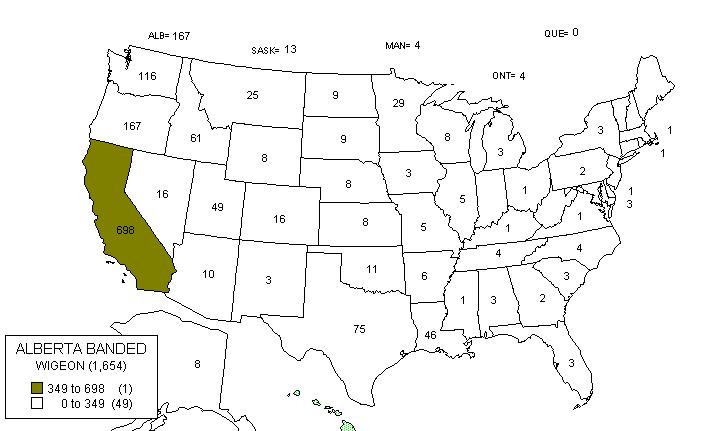
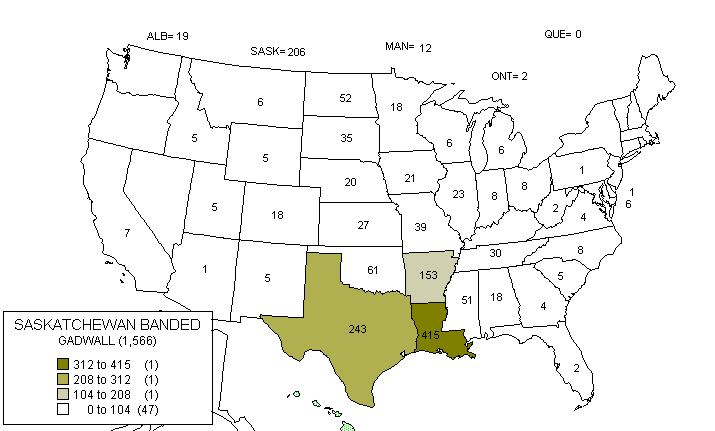
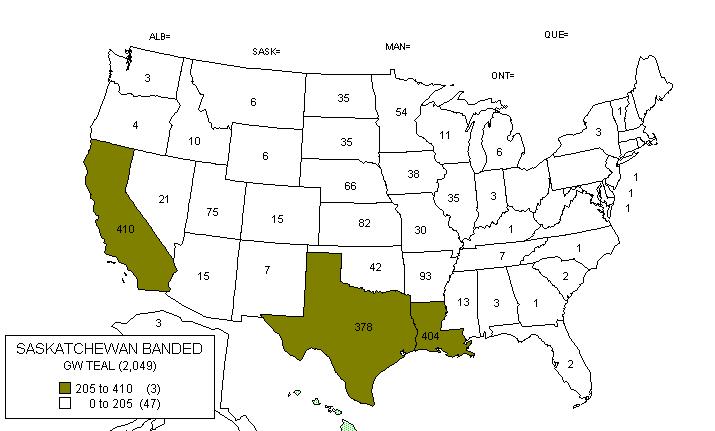
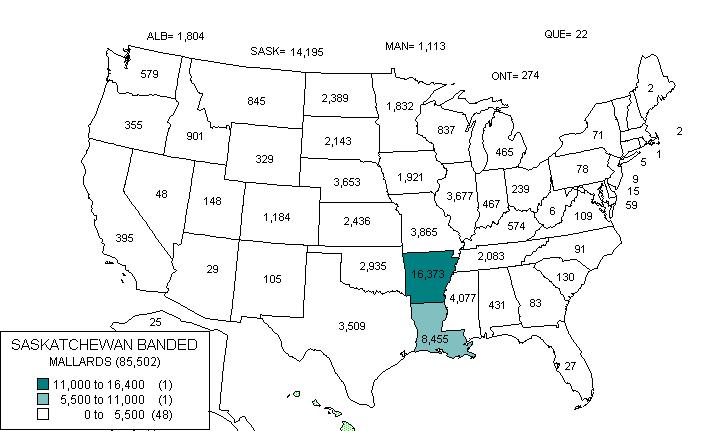
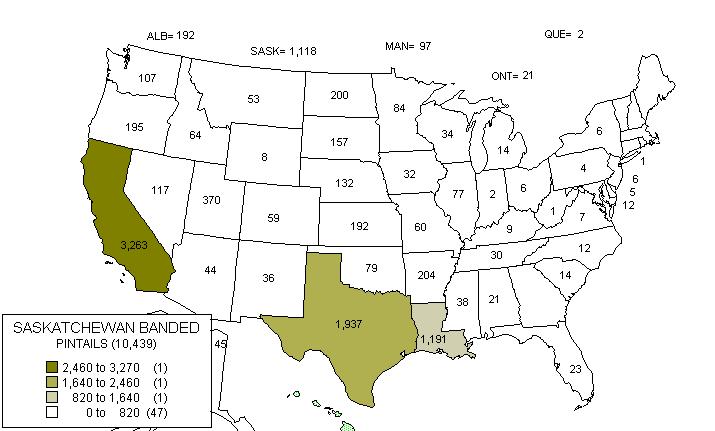
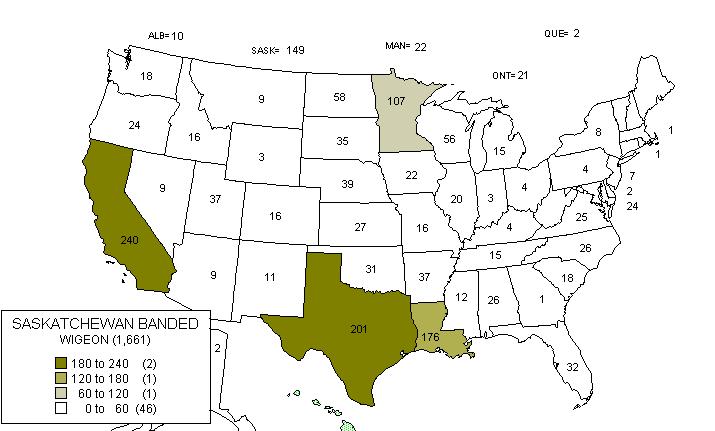
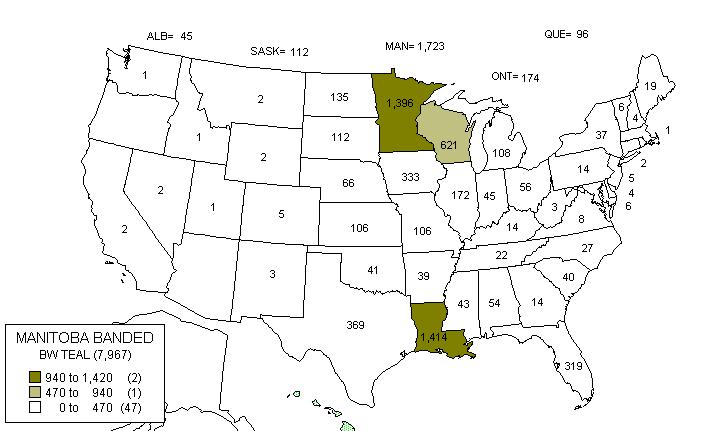
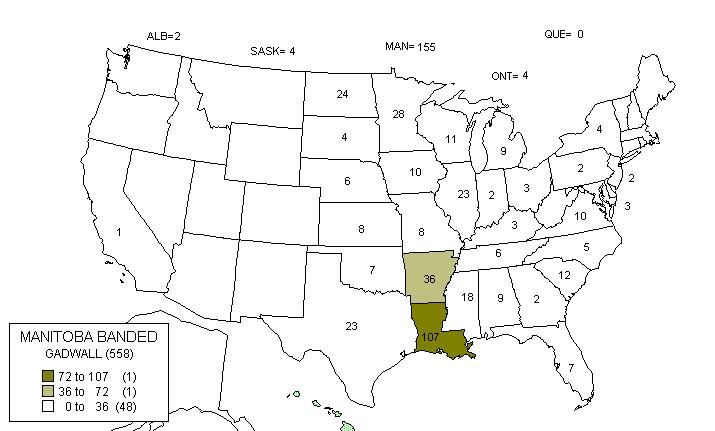
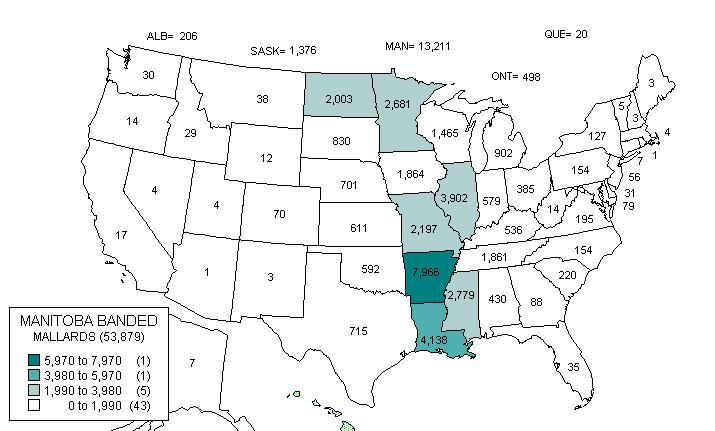
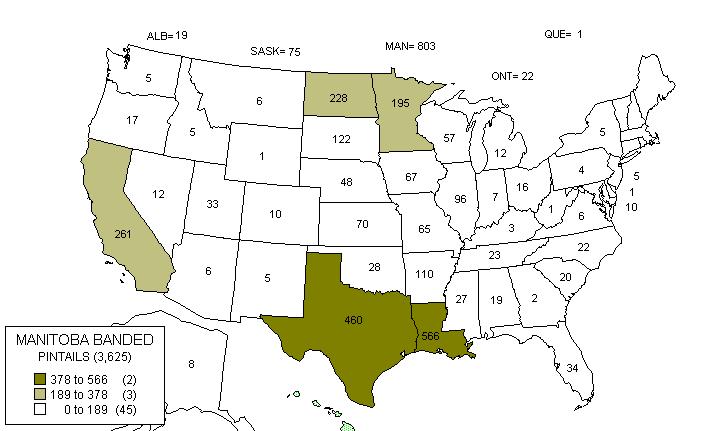
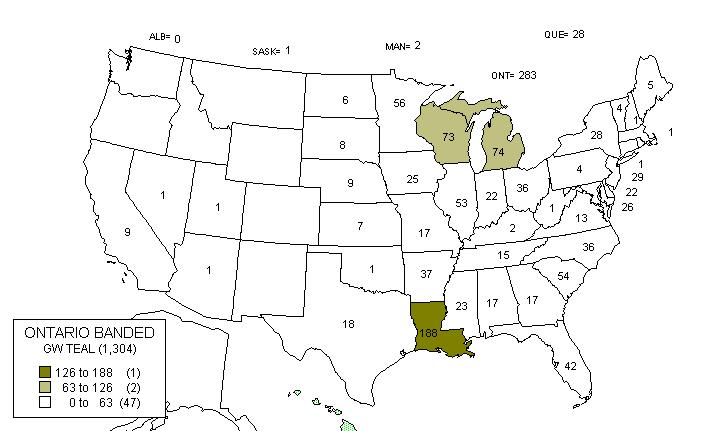
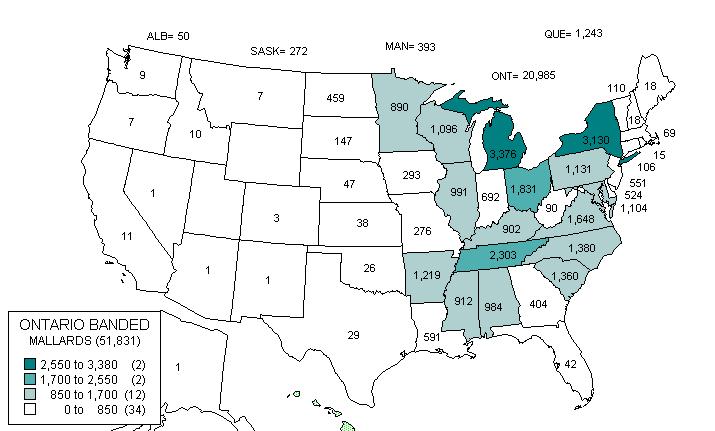
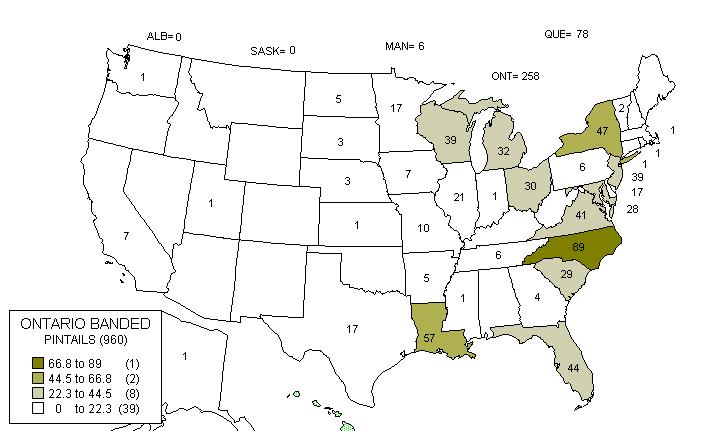
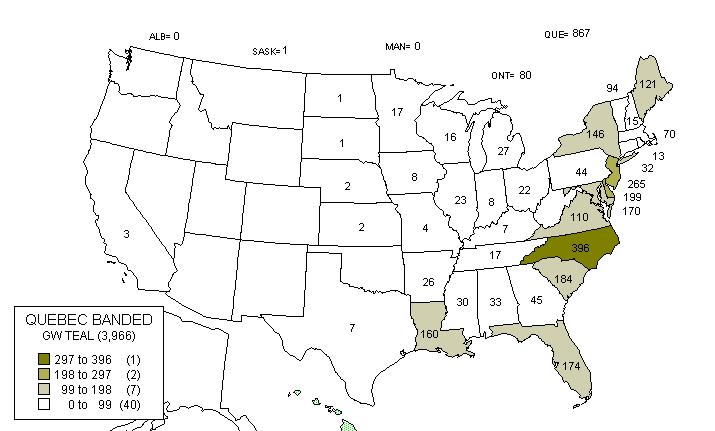
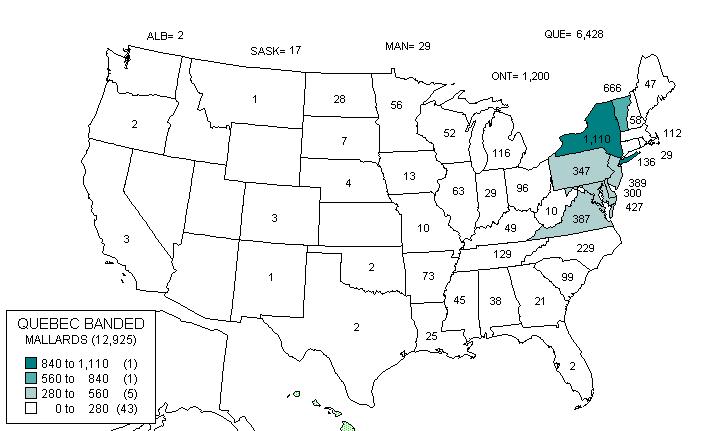
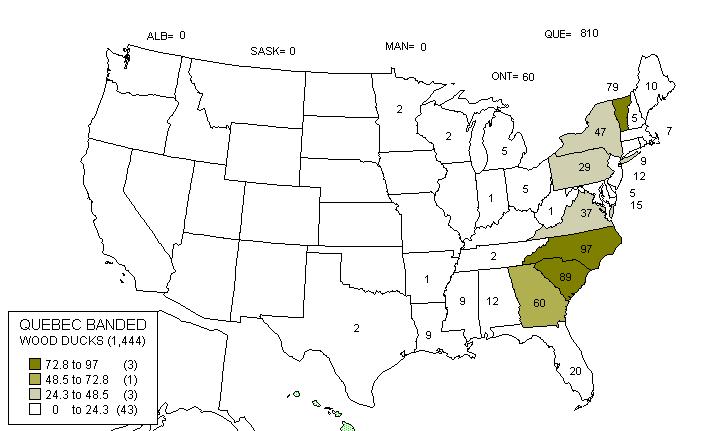
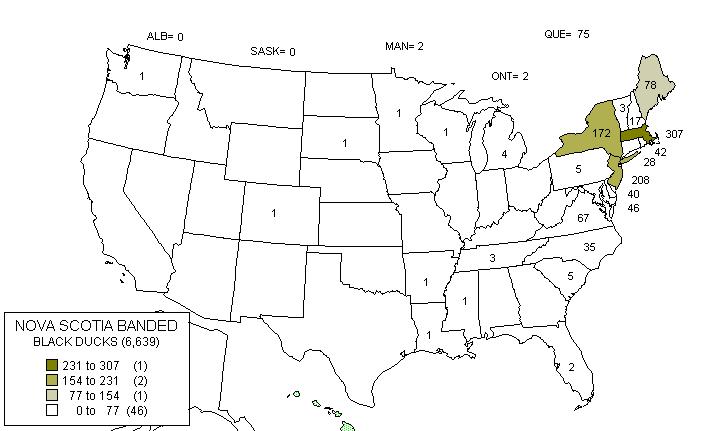
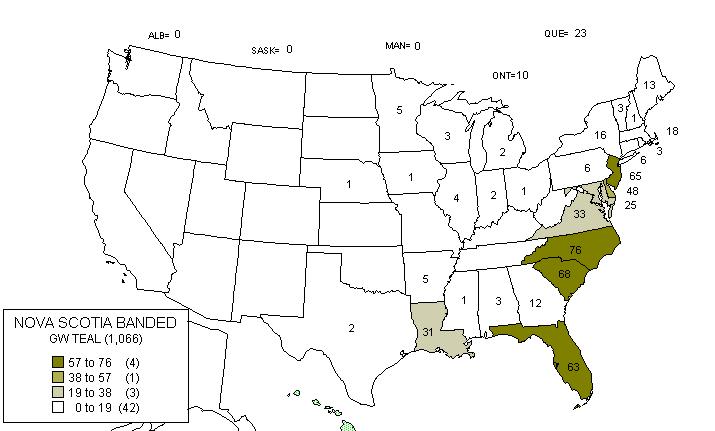
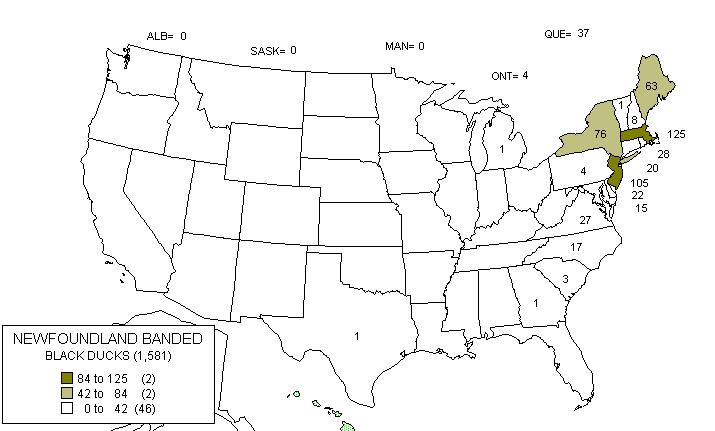
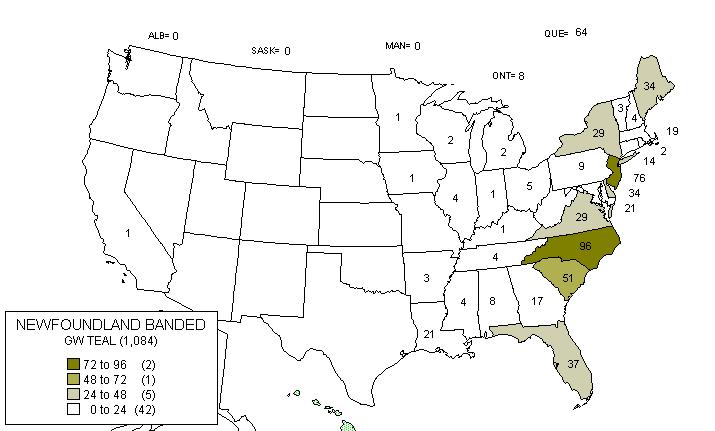
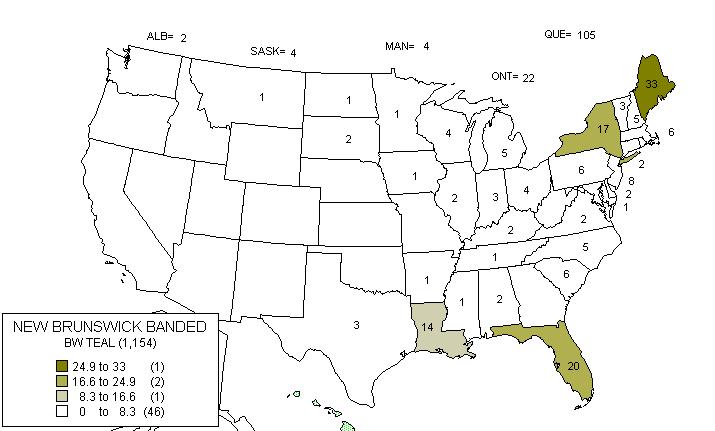
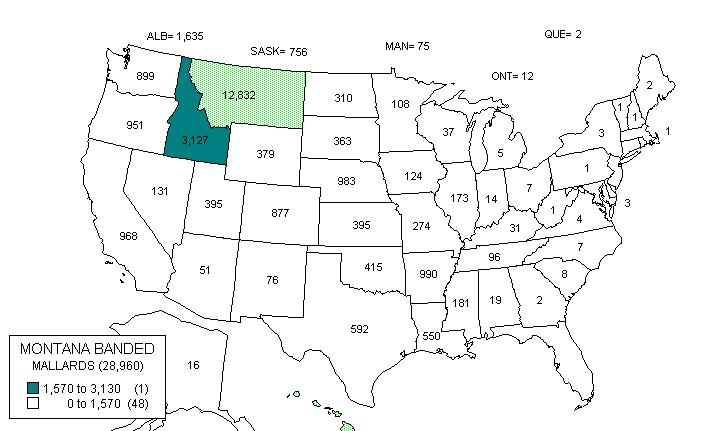
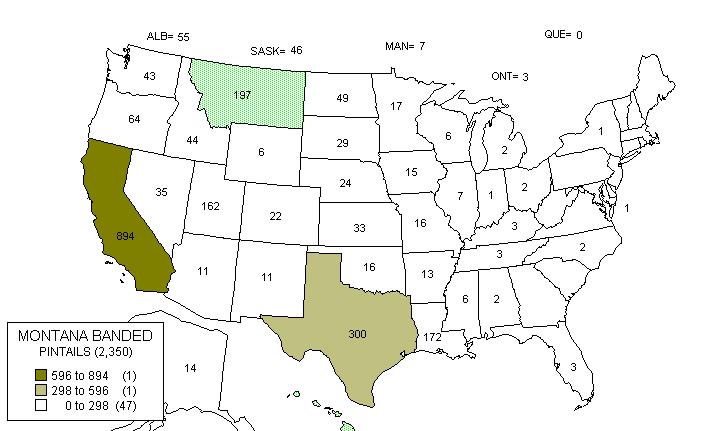
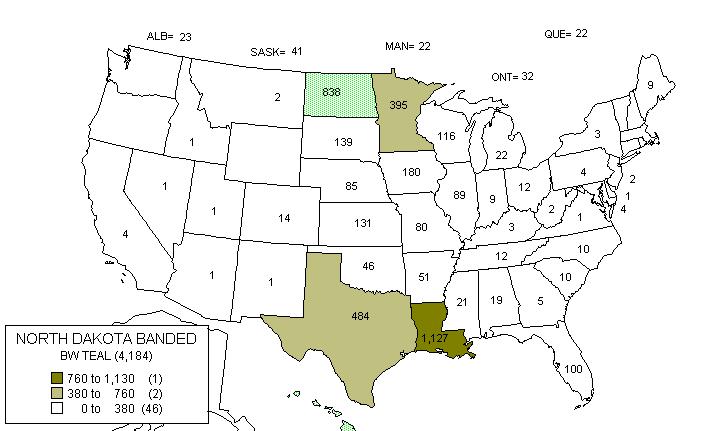
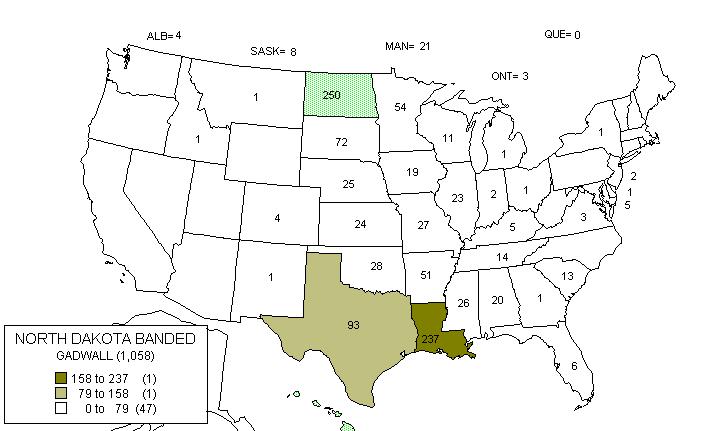
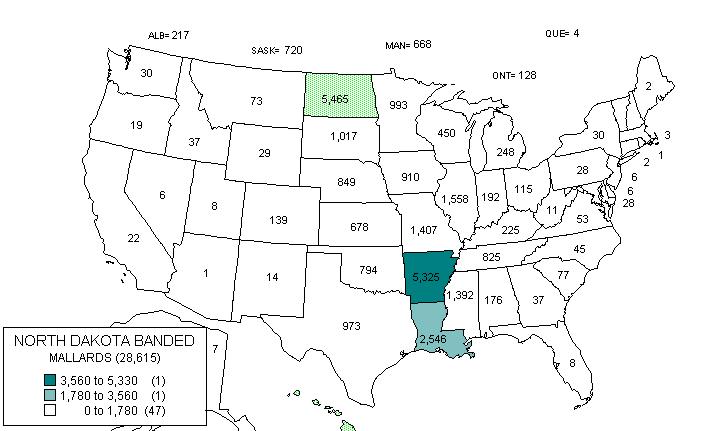
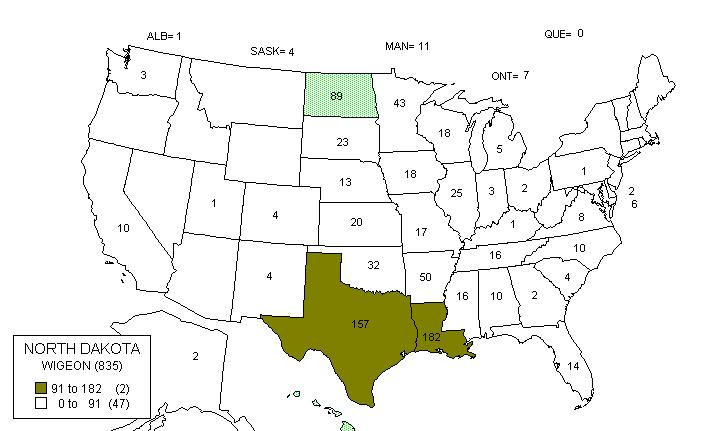
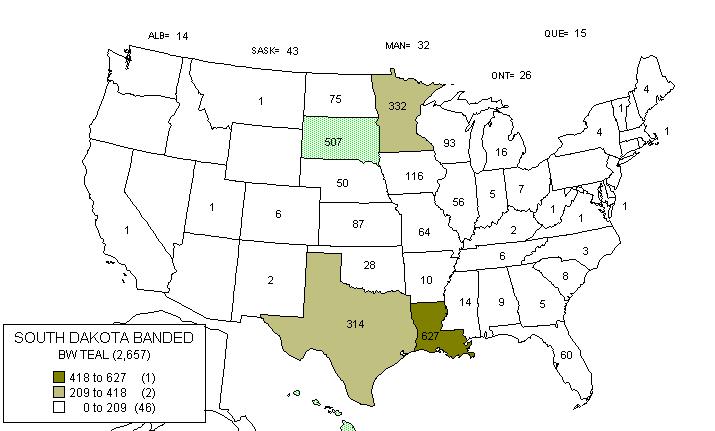
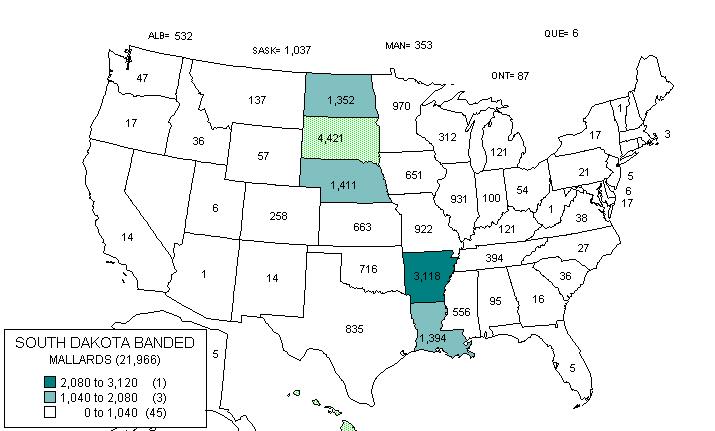
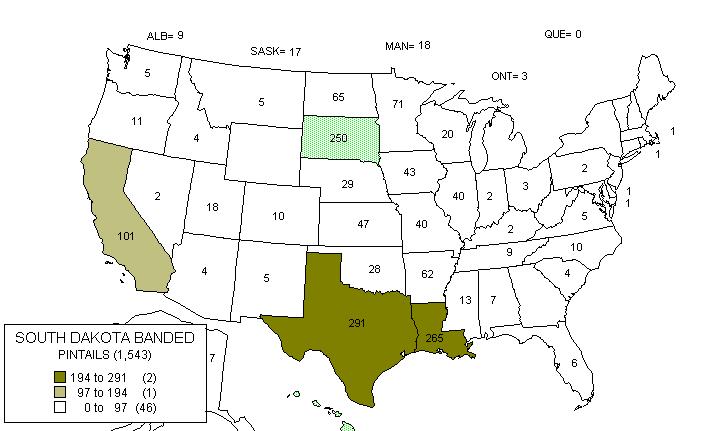
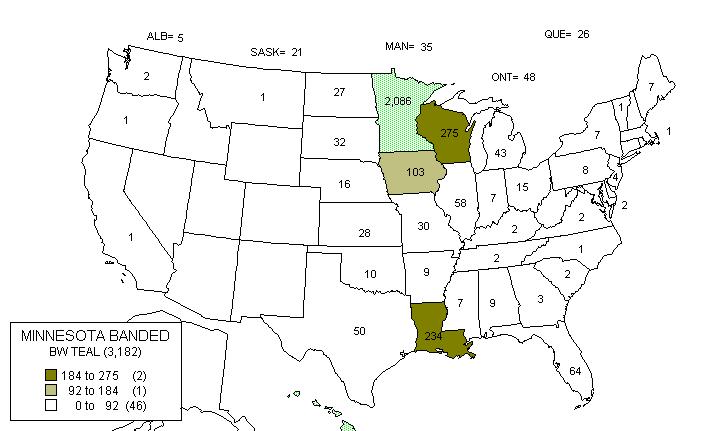
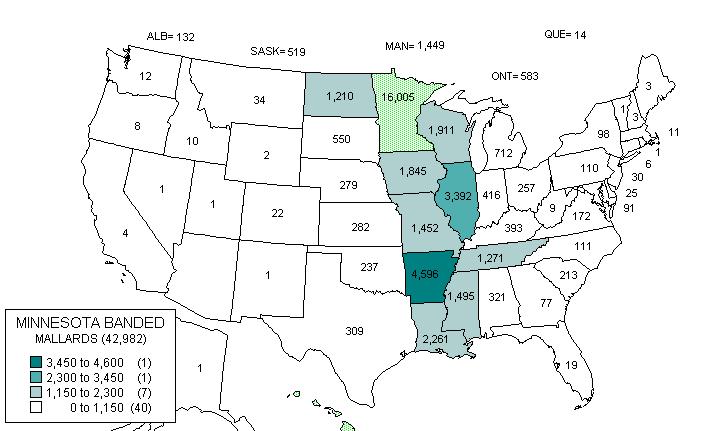
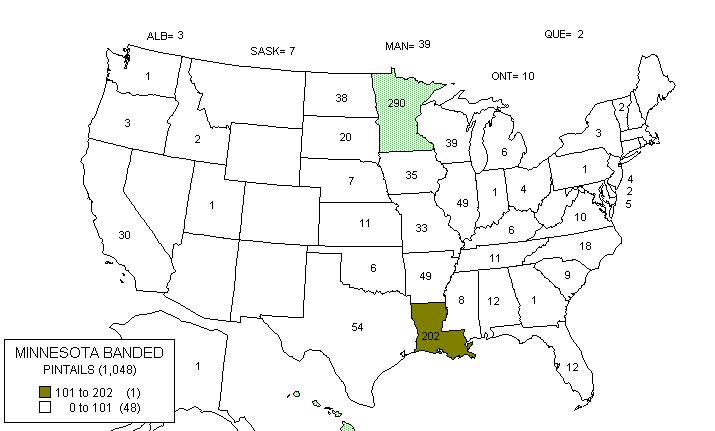
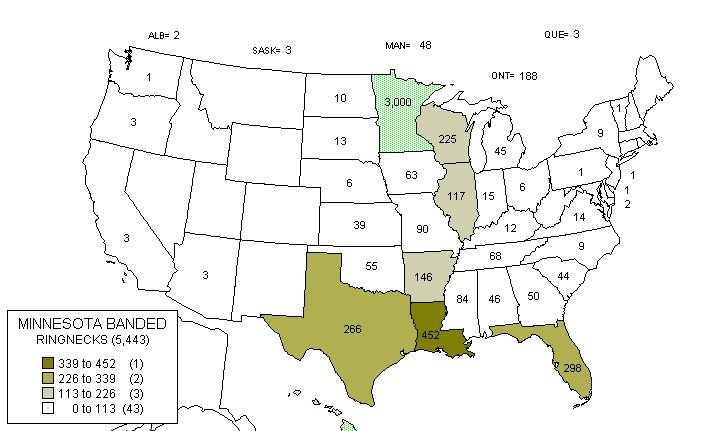
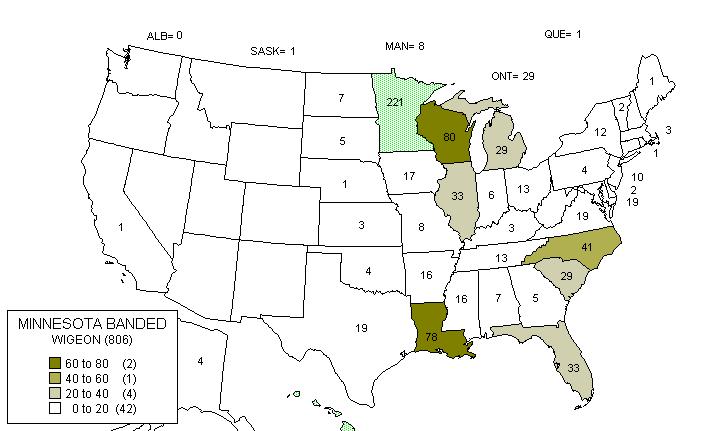
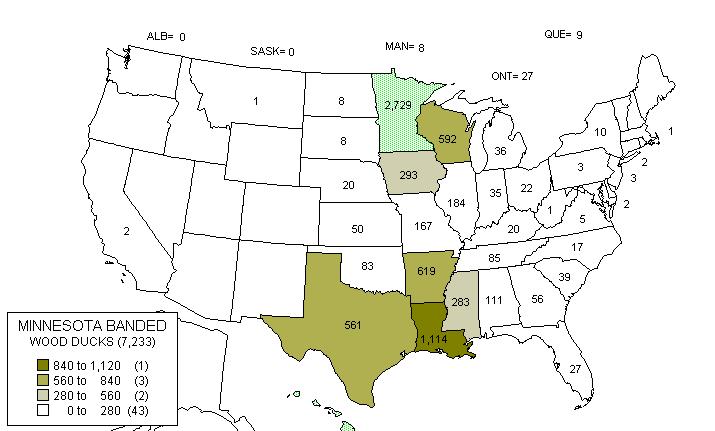
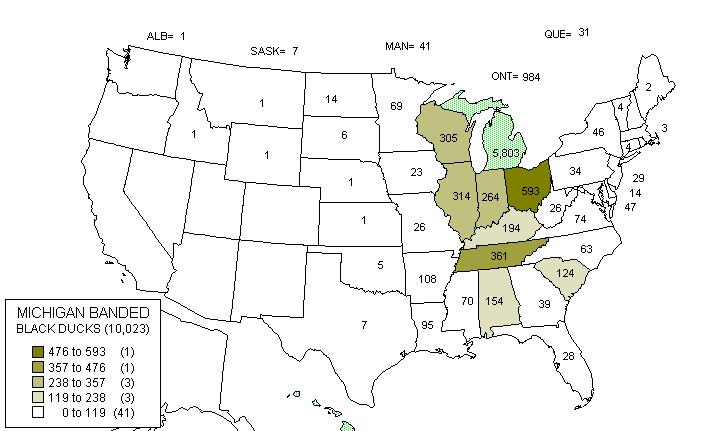
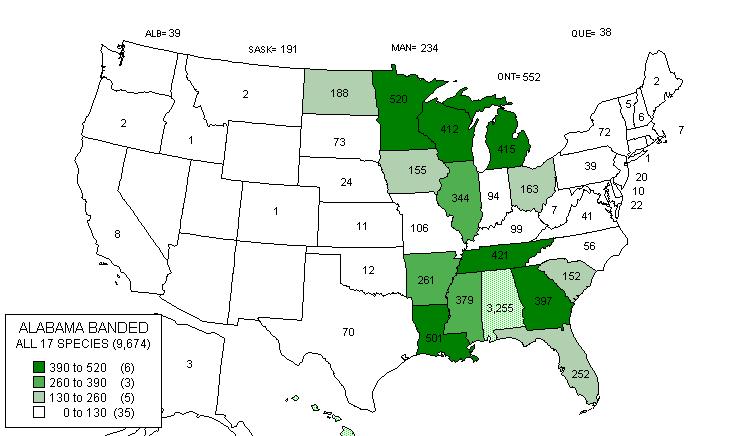
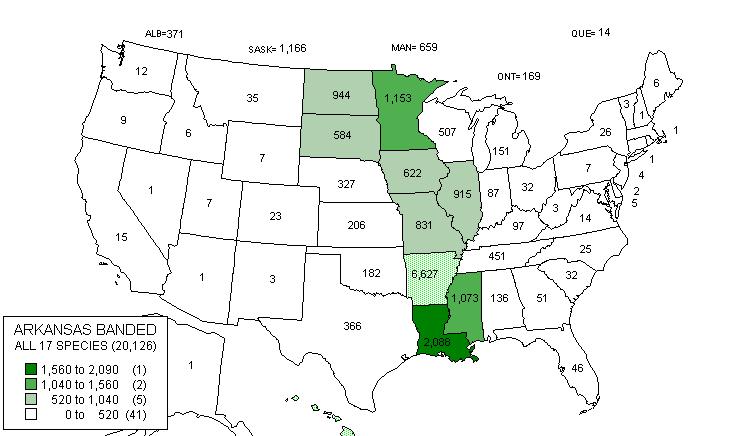
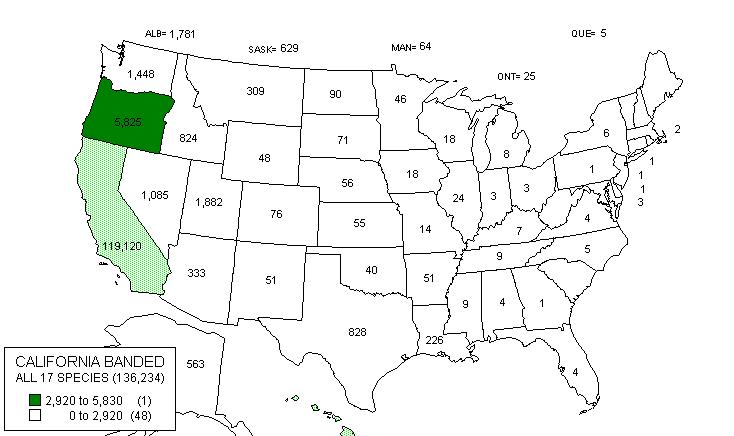
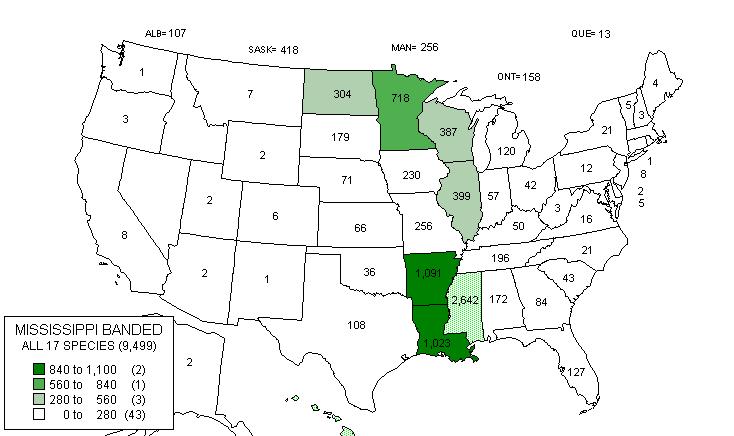
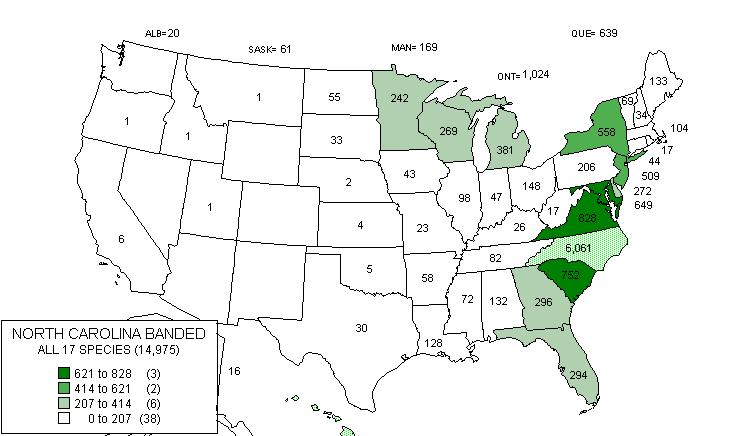
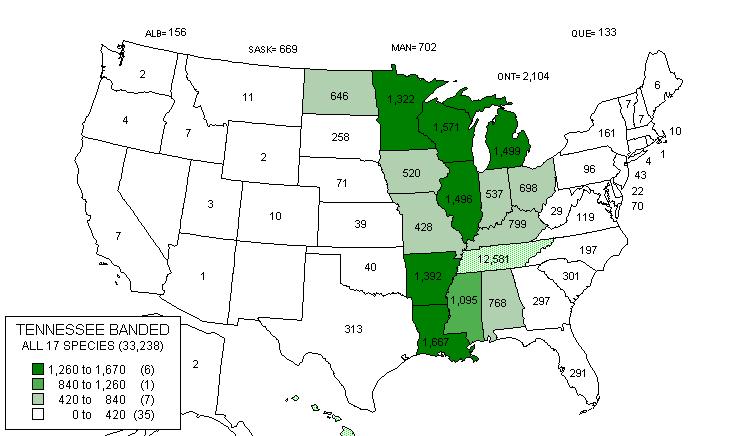
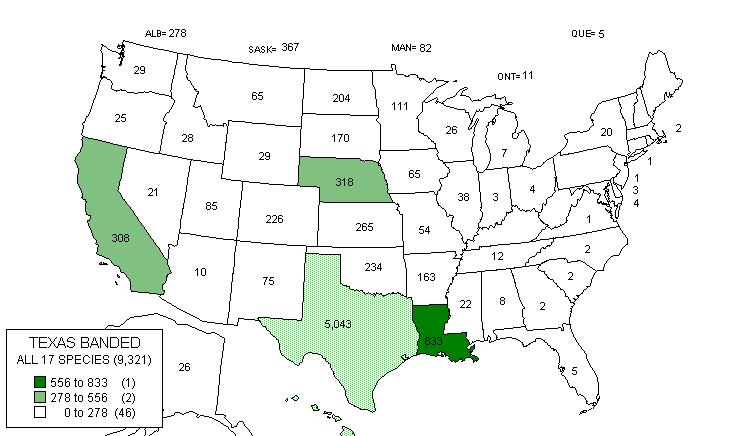
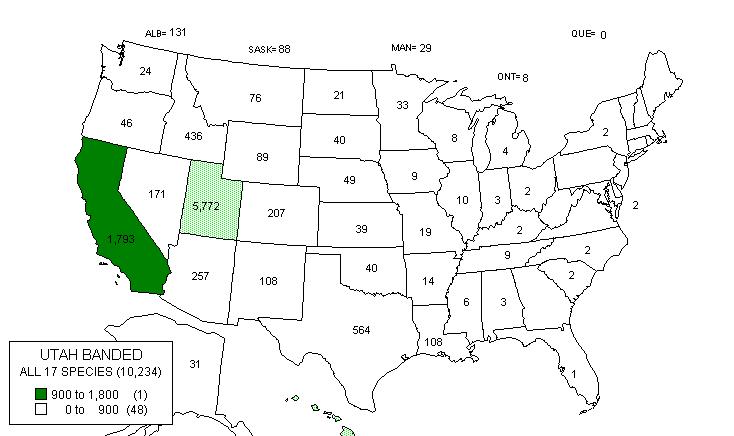
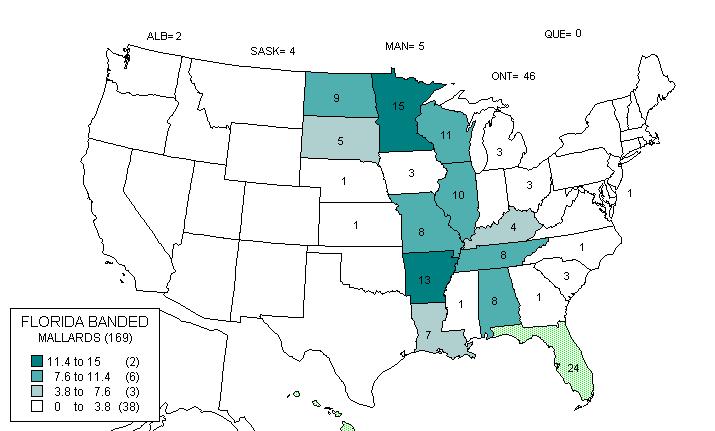
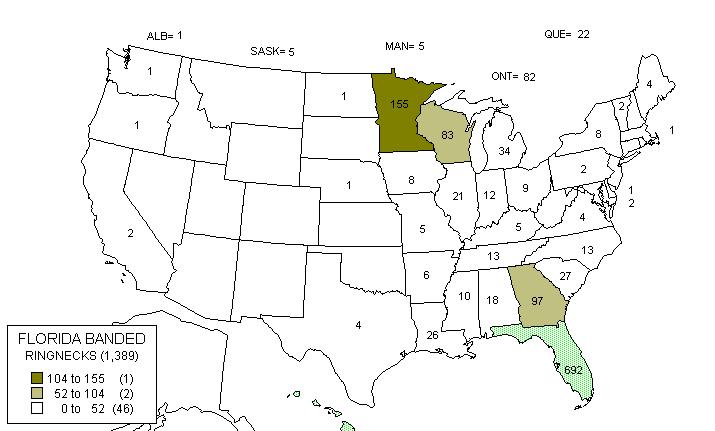
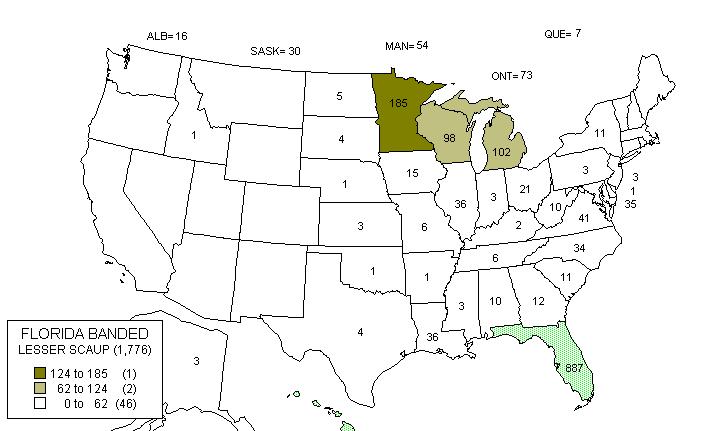
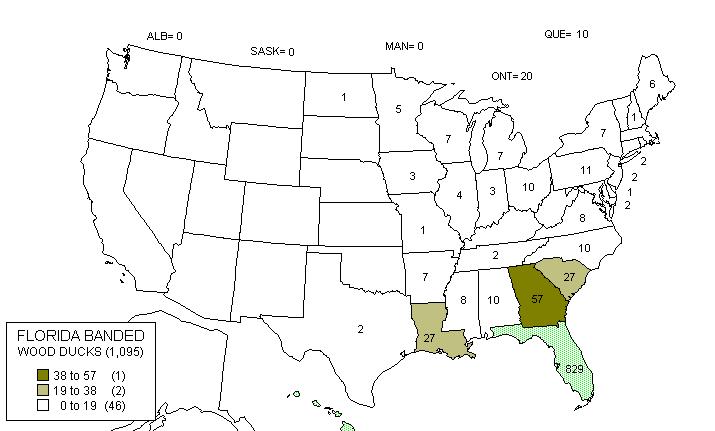
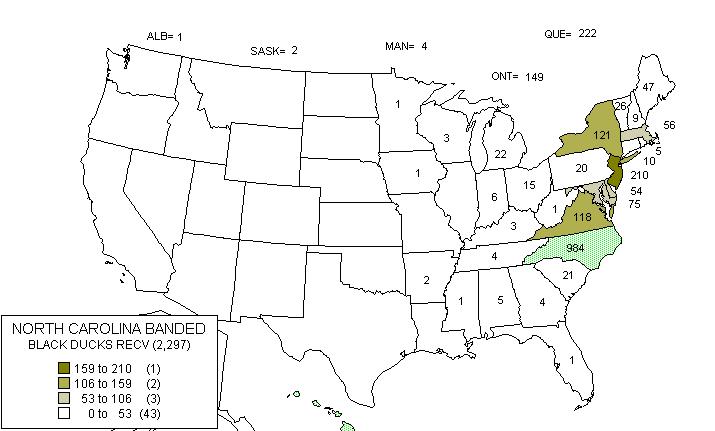
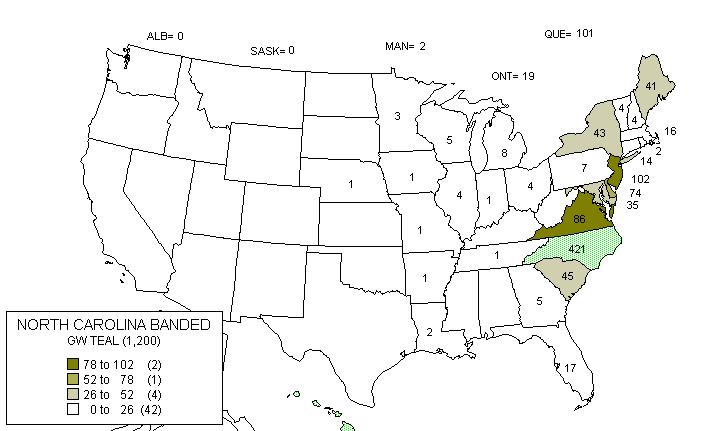
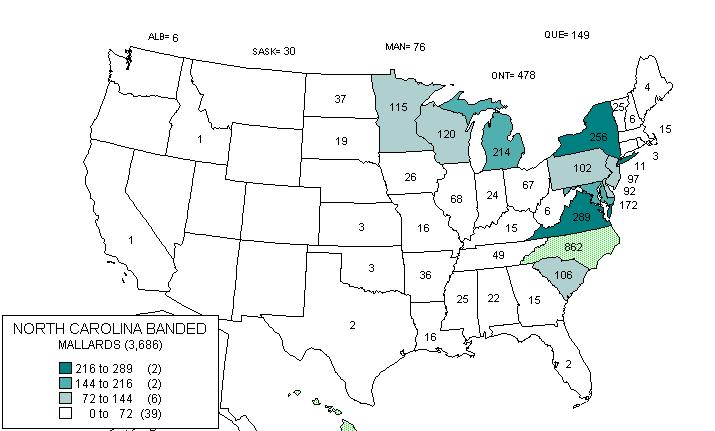
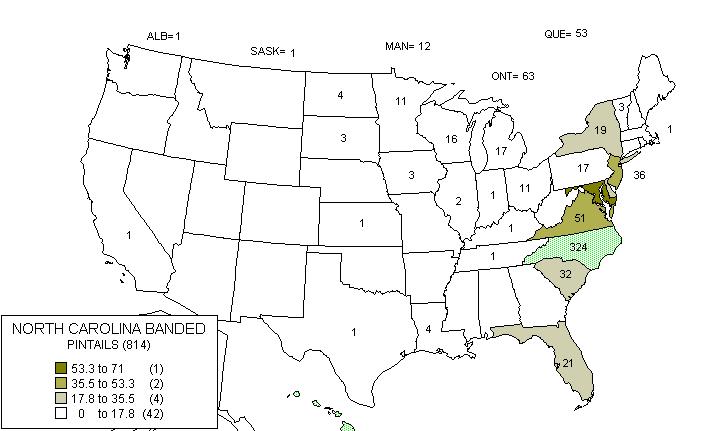
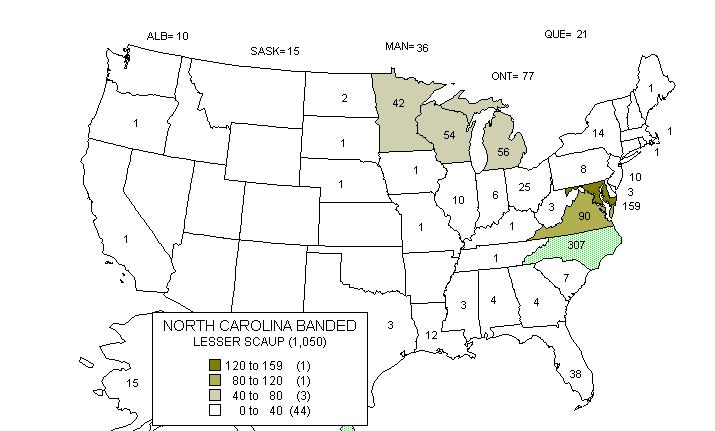
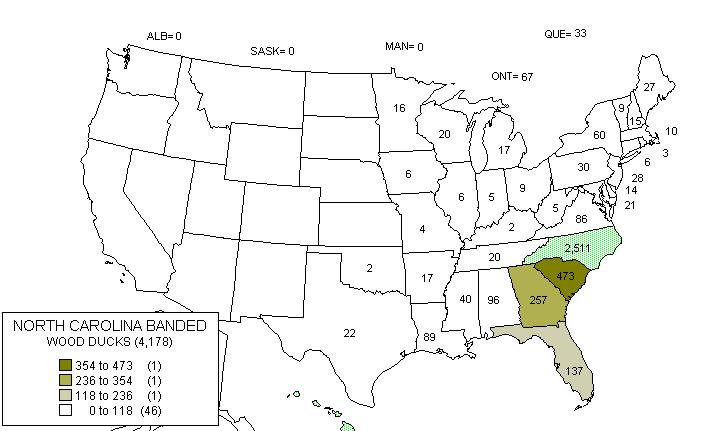
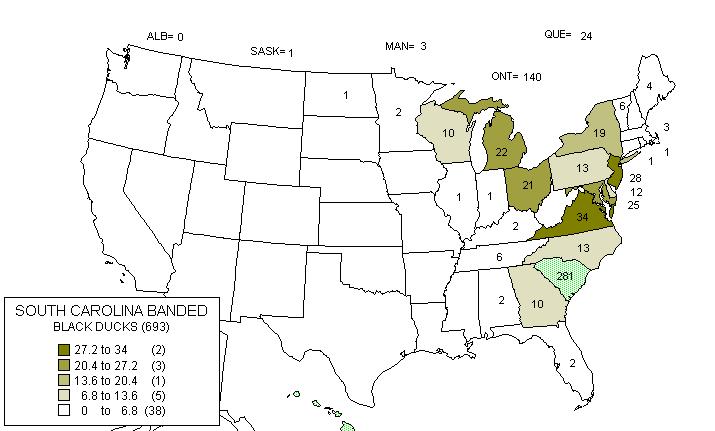
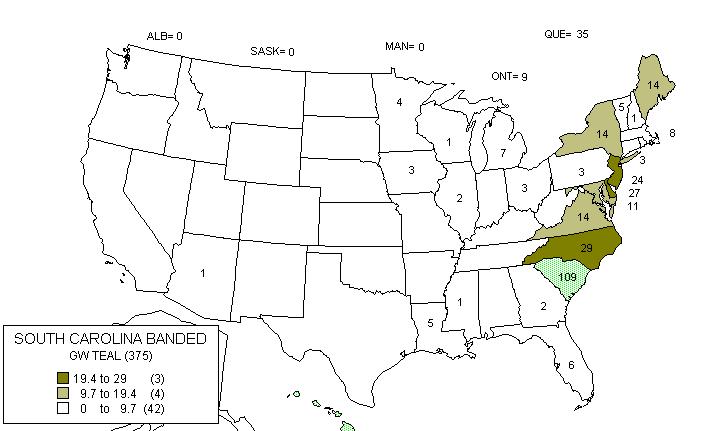
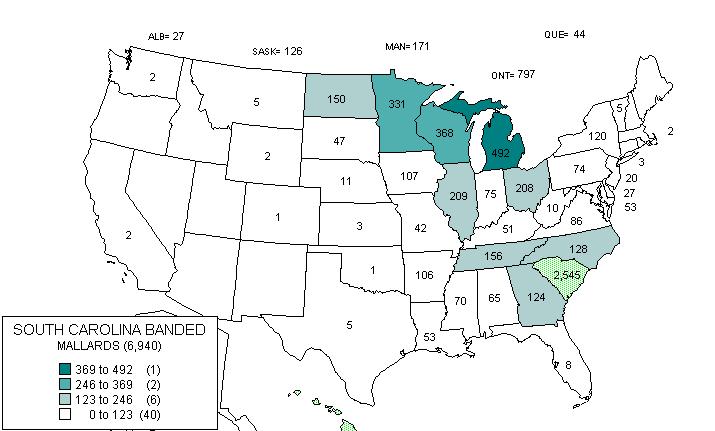
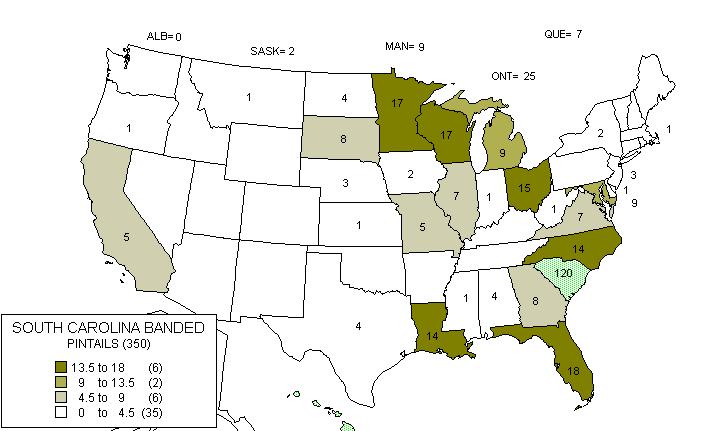
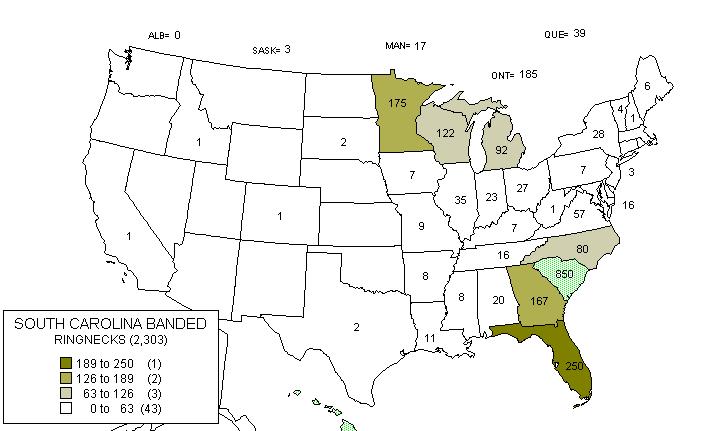
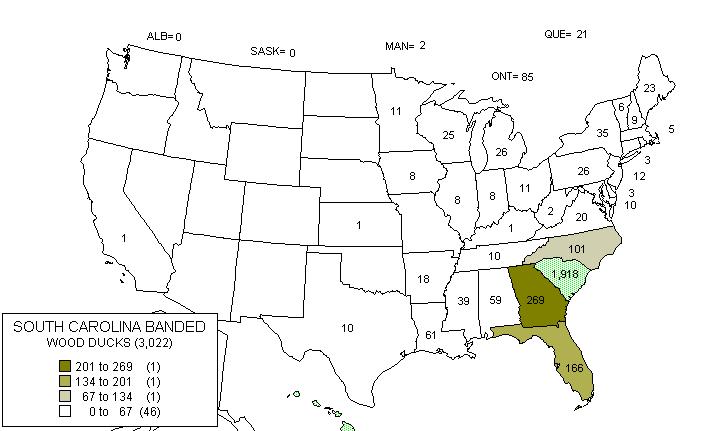
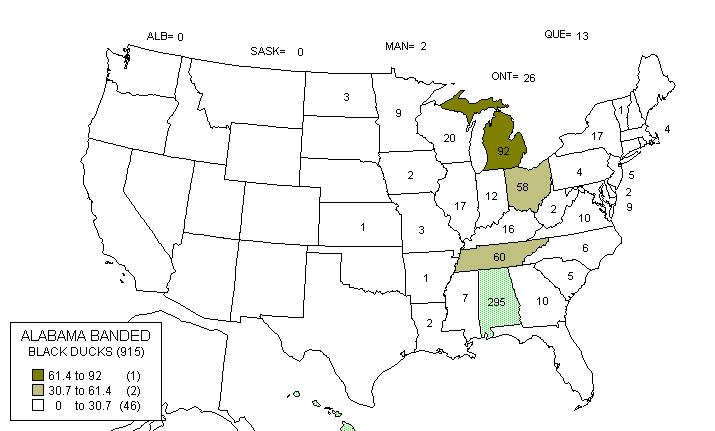
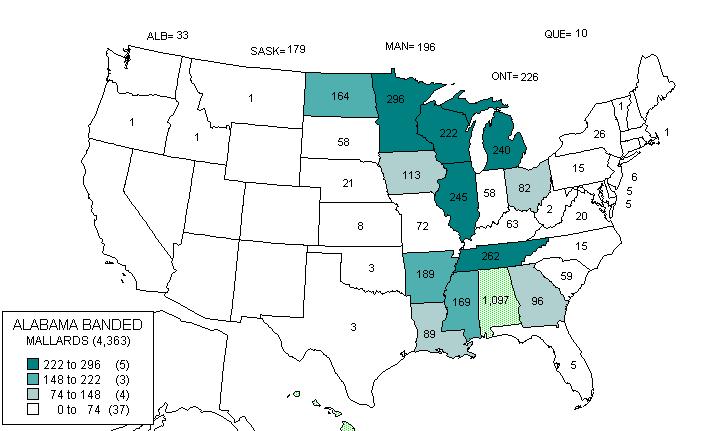
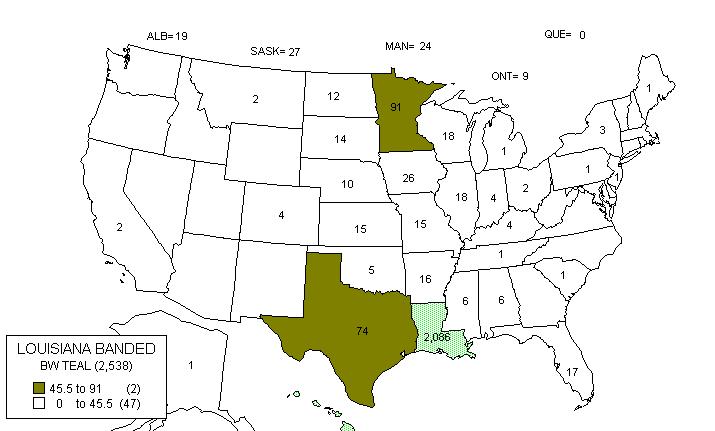
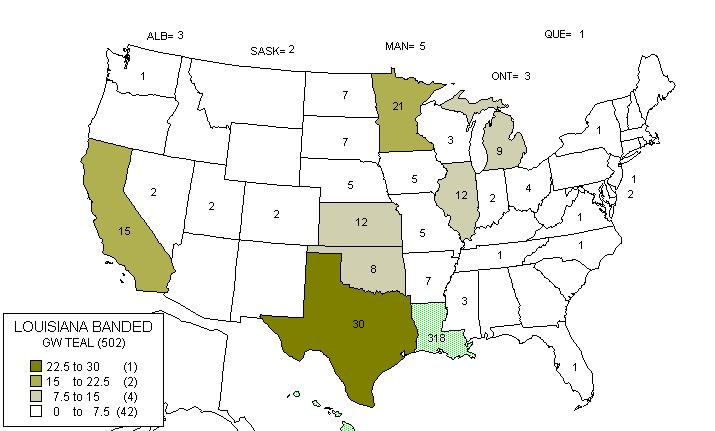
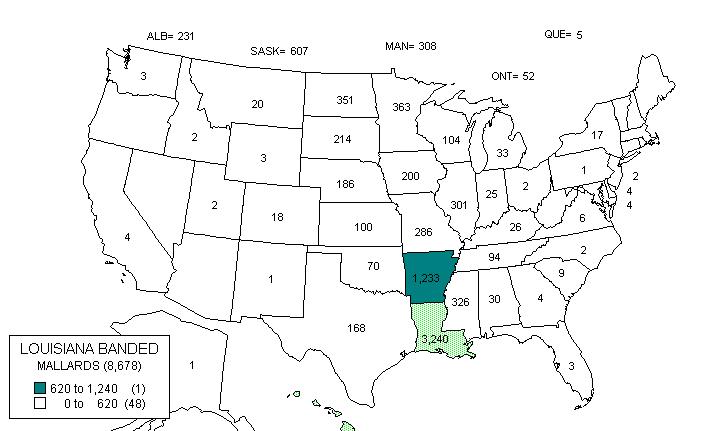
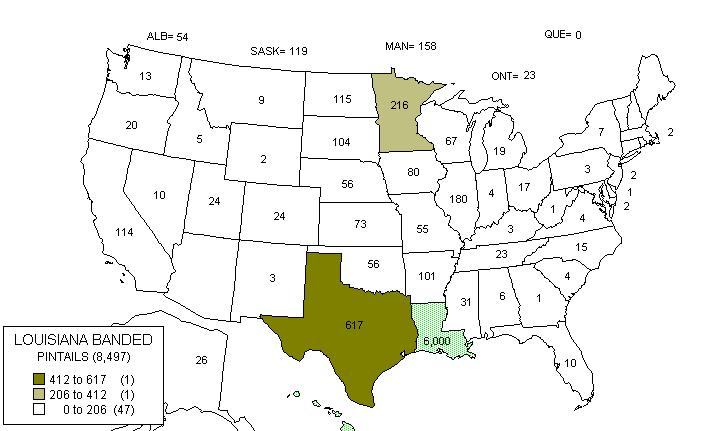
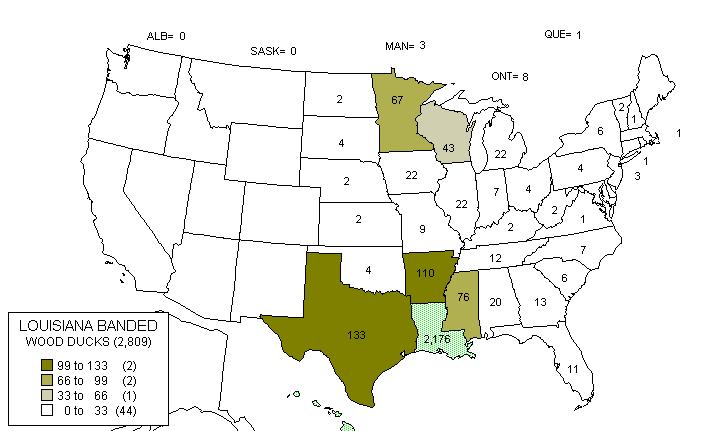
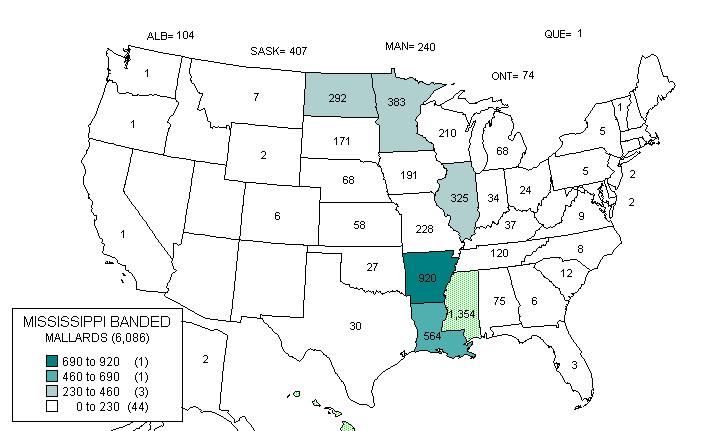
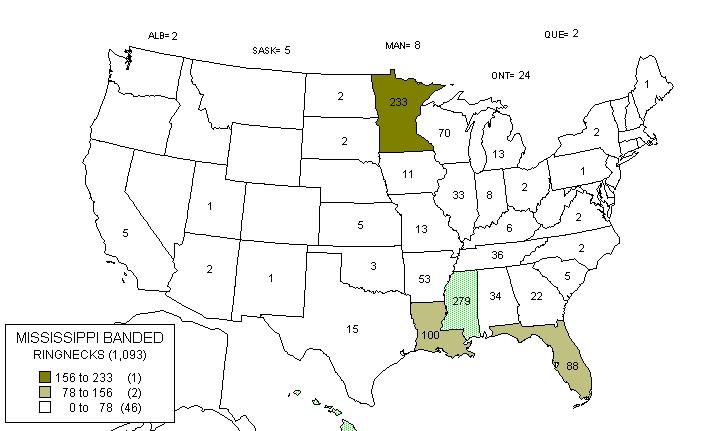
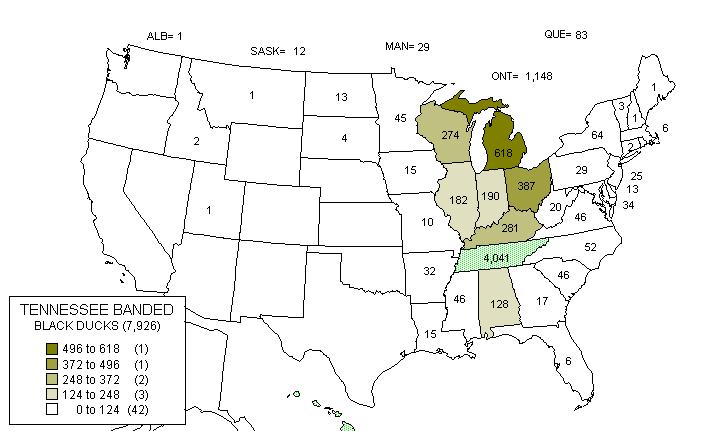
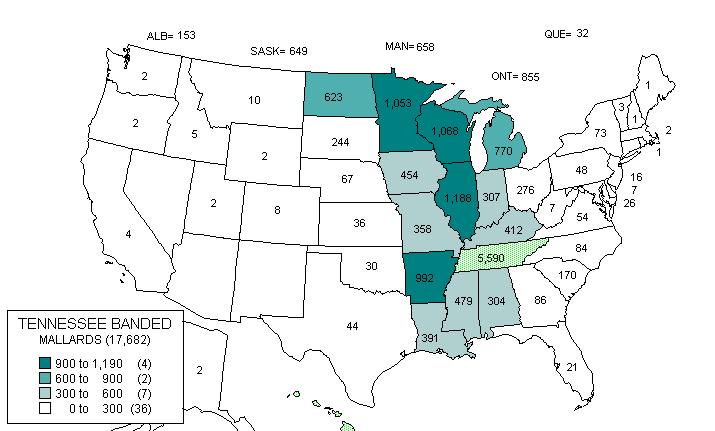
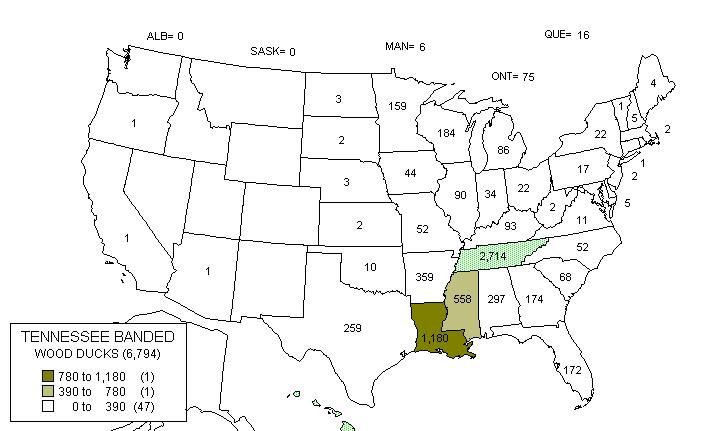
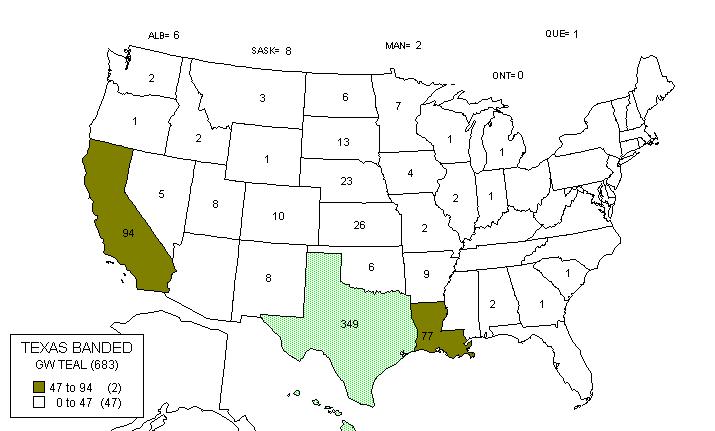
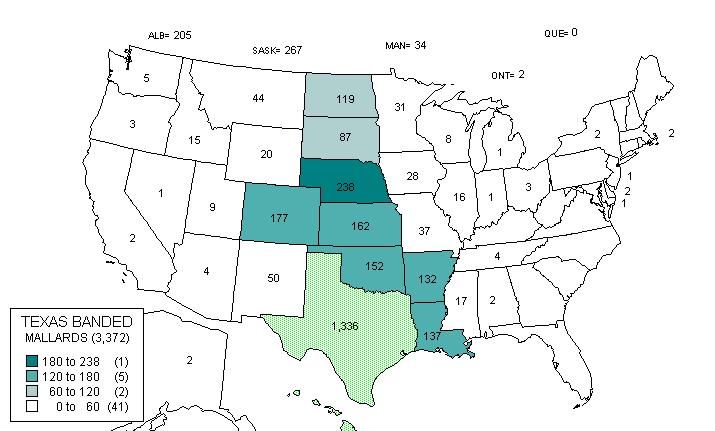
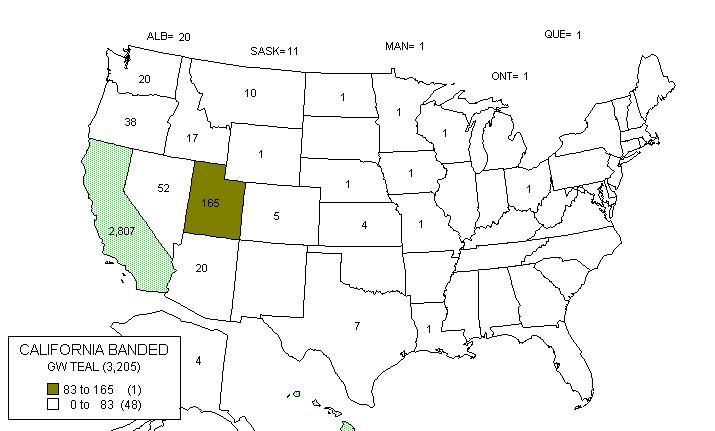
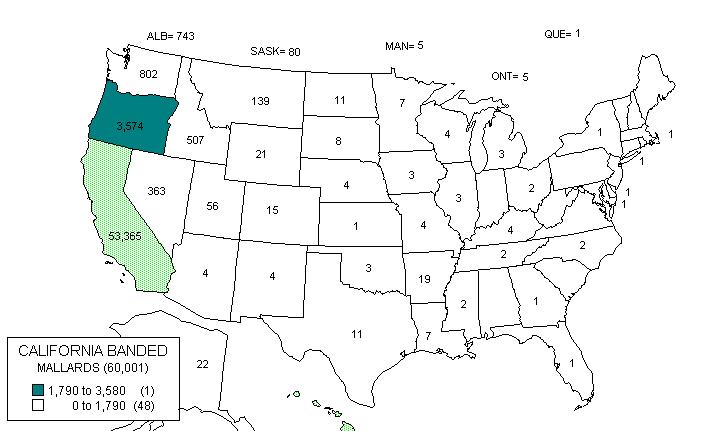
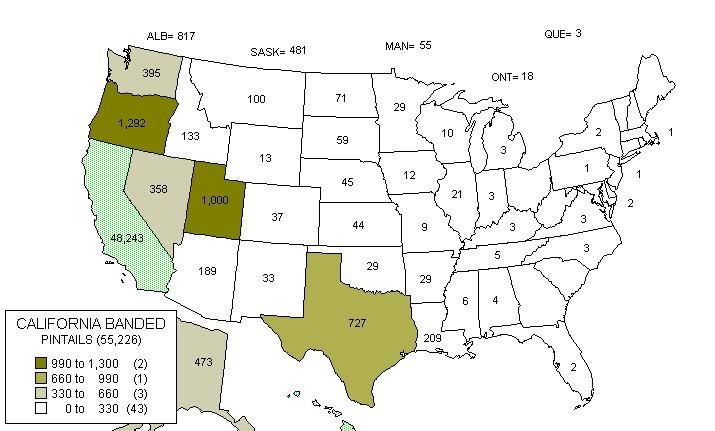
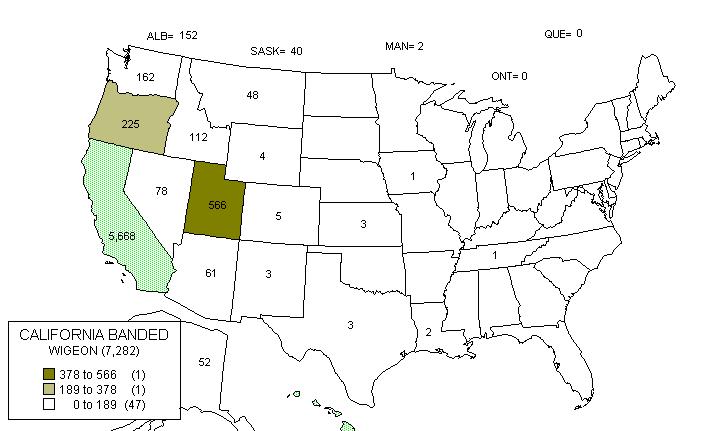
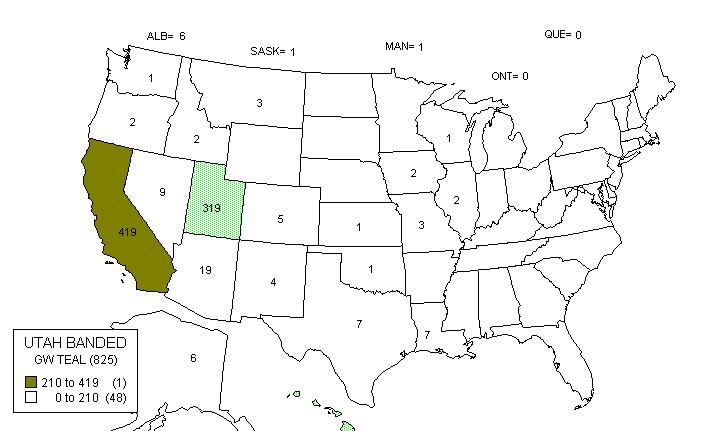
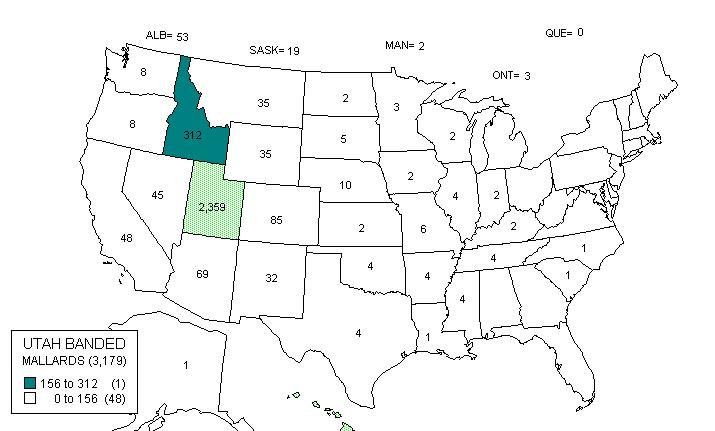
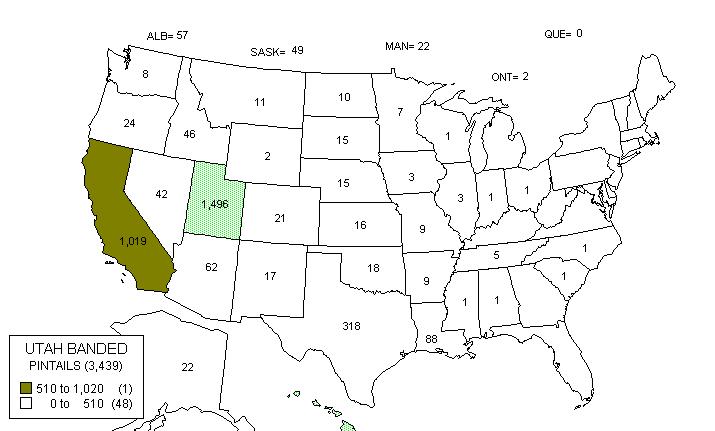